不同谷子品种喷施咪唑啉酮除草剂后的转录组分析
Transcriptome Analysis of Different Foxtail Millet (Setaria italica L.) Varieties Treated with Imazapic Herbicide
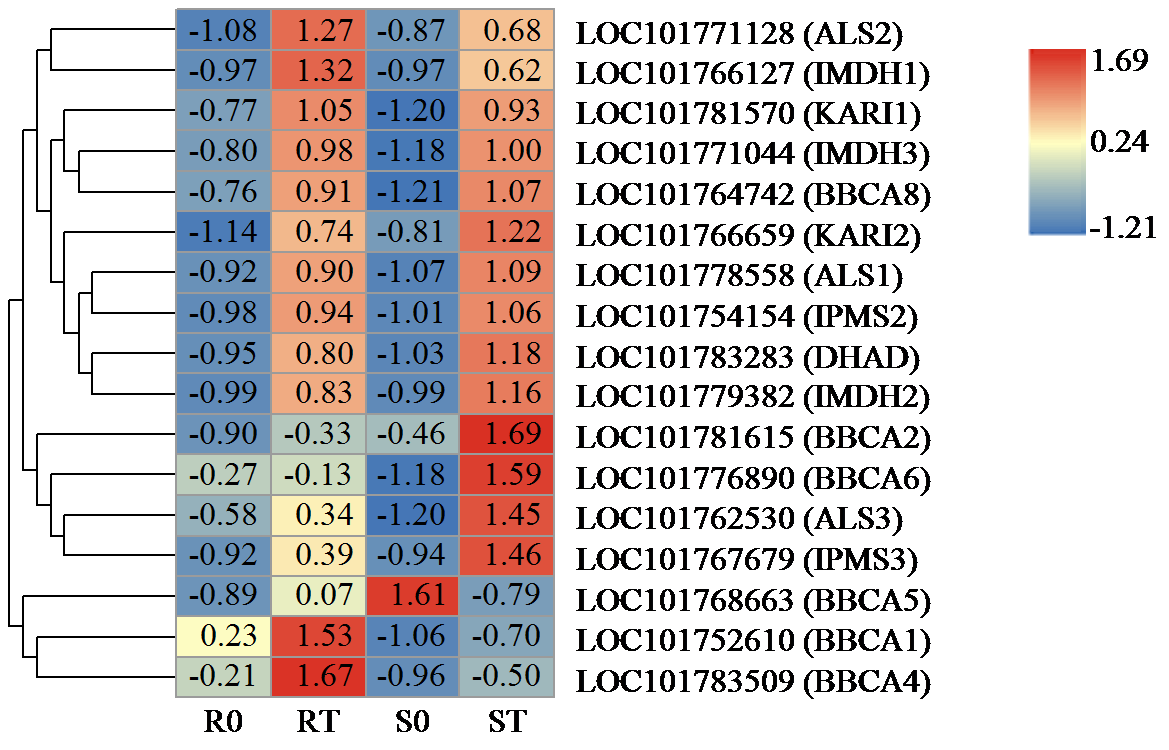
条形图表示热图中每个基因表达水平(log2 TPM)。基因的表达水平用不同的颜色表示。红色表示高表达,蓝色表示低表达。
The bar represents the scale of each gene's expression levels (log2 TPM) in the heat map. The expression level of the genes is denoted using different colours. Red denotes high expression while blue denotes low expression.