Crops ›› 2023, Vol. 39 ›› Issue (2): 229-237.doi: 10.16035/j.issn.1001-7283.2023.02.033

Previous Articles     Next Articles

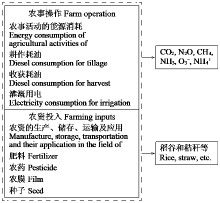
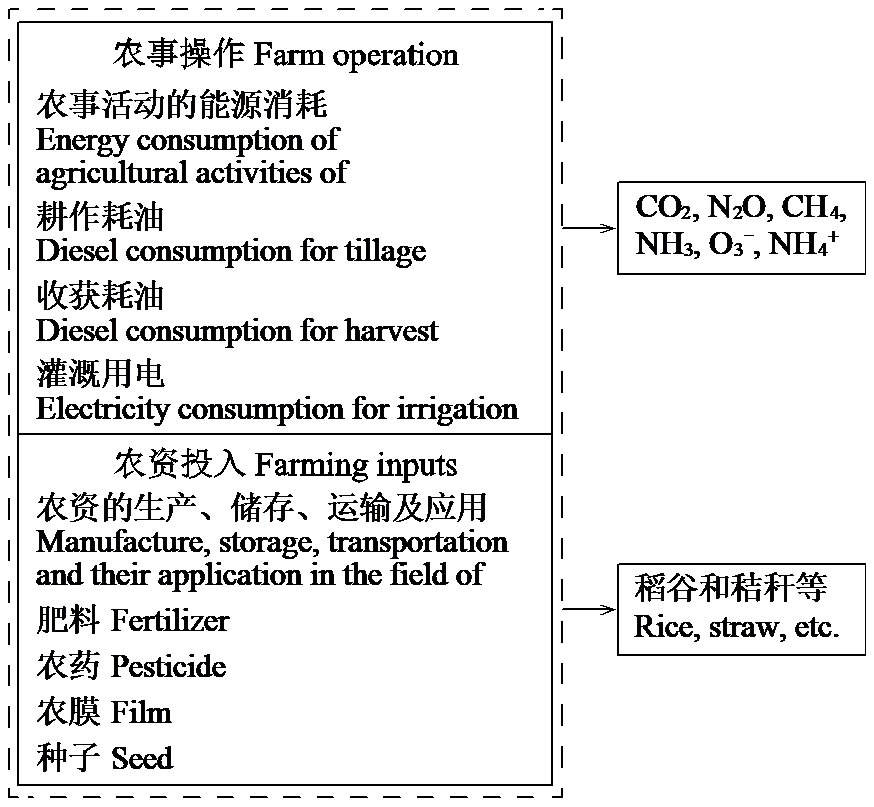
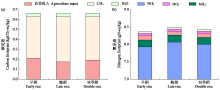
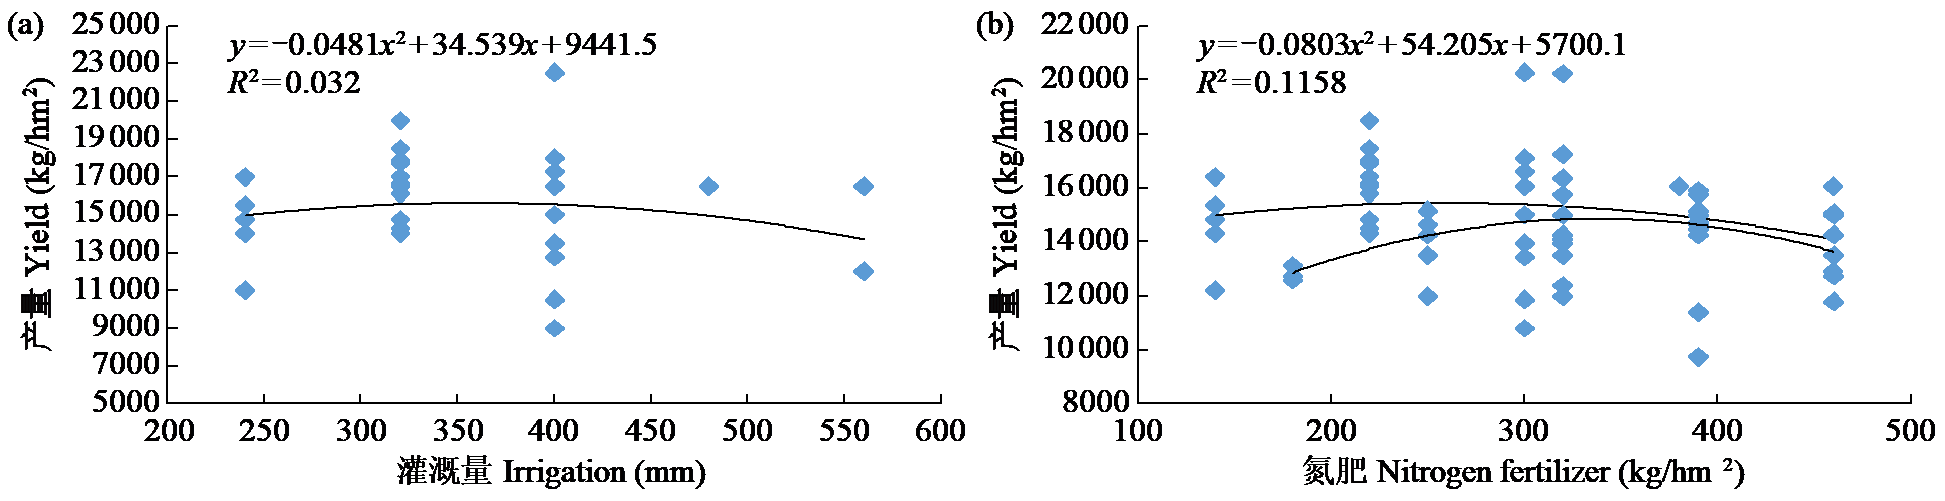
Carbon and Nitrogen Footprints of Double Rice Production in Yangtze River Based on Farm Survey Data——A Case Study of Jiangxi and Hunan

Chen Zhongdu(), Xu Chunchun, Ji Long, Fang Fuping()   

  1. China National Rice Research Institute, Hangzhou 311300, Zhejiang, China
  • Received:2022-11-18 Revised:2022-12-28 Online:2023-04-15 Published:2023-04-11

Abstract:

Quantifying the carbon footprint (CF) and nitrogen footprint (NF) of crop production can help identify key options to mitigate greenhouse gas and reactive nitrogen emissions from agriculture. Based on farmer's production survey data, the CF and NF of rice production in the Yangtze River were estimated. The results showed the CF and NF per unit yield for rice production in Yangtze River were 0.50-0.90kgCO2-eq/kg and 5.20-13.17gN-eq/kg, respectively. The largest fraction of CF and NF of rice was the share of CH4 emission and NH3 volatilization, respectively. The scale of planting was negatively correlated with the CF and NF, and a decrease in the CF and NF were found in large sized farms (more than 3.3ha) by 33.8% and 44.1%, respectively, compared to smaller ones lower than 0.7ha. 53.1% of a field exposed to excessive fertilizer and 54.9% of a field exposed to excessive irrigation showed low yields. Improving farmers' education level and awareness of low-carbon and green agriculture could significantly reduce the CF and NF of rice production. Thus, developing technology that limits water and fertilizer consumption, as well as developing in farm machinery operation efficiencies and large scaled farms, strengthen the popularization of knowledge and culture level of farmers and low carbon green agriculture knowledge and guidance of different types of adaptive behavior; improve the innovation and promotion mechanism of low carbon green agriculture technology would be favorable toward mitigating climate change and eutrophication of double rice production in Yangtze River.

Key words: Key words Carbon footprint, Nitrogen footprint, Double rice cropping, Ecological assessment, Life cycle assessment

Fig.1

The system boundary"

Table 1

Coefficients of GHG and reactive nitrogen emission of different material for agricultural production"

项目
Item
碳排放系数
Carbon emission
coefficient
氮排放系数
Nitrogen emission
coefficient
柴油Diesel 0.89kgCO2-eq/kg 0.56gN-eq/kg
柴油燃烧Diesel combustion 4.10kgCO2-eq/kg 4.10gN-eq/kg
灌溉用电
Electricity for irrigation
0.82kgCO2-eq/kW?h
0.76N-eq/kW?h
氮肥N fertilizer 1.53kgCO2-eq/kg 0.47gN-eq/kg
磷肥P2O5 1.63kgCO2-eq/kg 0.36gN-eq/kg
钾肥K2O 0.65kgCO2-eq/kg 0.03gN-eq/kg
农膜Flim 22.72kgCO2-eq/kg 12.02gN-eq/kg
杀虫剂Insecticides 16.61kgCO2-eq/kg 3.55gN-eq/kg
除草剂Herbicides 10.15kgCO2-eq/kg 4.49gN-eq/kg
杀菌剂Fungicides 10.57kgCO2-eq/kg 7.05gN-eq/kg
水稻种子Rice seed 1.84kgCO2-eq/kg 0.76gN-eq/kg

Fig.2

Carbon footprint and nitrogen footprint of double rice production in Yangtze River"

Fig.3

Mean proportions of the carbon footprint and nitrogen footprint of double rice in Yangtze River"

Table 2

Characteristics of indirect carbon emissions and nitrogen (Nr) emissions of double rice production in Yangtze River"

种类Item 碳排放Carbon emission (kgCO2-eq/hm2) 氮排放Nr emission (gN-eq/hm2)
早稻
Early rice
晚稻
Late rice
双季稻
Double rice
早稻
Early rice
晚稻
Late rice
双季稻
Double rice
柴油Diesel 635.9±157.9 608.8±147.6 1244.7±279.6 607.8±151.0 582.0±141.1 1189.8±267.3
氮肥N 383.4±82.6 423.5±97.0 806.9±165.1 77.0±16.6 85.1±19.5 162.1±33.2
磷肥P2O5 39.5±19.4 53.9±29.4 93.5±44.4 21.7±10.6 29.6±31.8 51.3±35.6
钾肥K2O 66.2±28.0 72.1±28.6 138.2±52.2 3.0±1.3 3.3±1.3 6.3±2.4
灌溉Irrigation 21.5±13.4 29.4±16.2 50.8±27.6 19.9±12.4 27.2±15.0 47.1±25.6
农膜Film 164.4±33.1 164.4±33.1 87.0±17.5 87.0±17.5
种子Rice seed 115.5±57.9 85.7±47.7 201.1±86.3 47.7±23.9 35.4±19.7 83.1±35.6
除草剂Herbicides 2.0±0.8 3.5±2.1 5.4±2.2 0.9±0.4 1.5±0.9 2.4±1.0
杀虫剂Insecticides 8.1±3.7 11.4±6.7 19.5±8.2 1.7±0.8 2.4±1.4 4.2±1.7
杀菌剂Fungicides 8.6±3.9 8.1±3.9 16.6±7.0 5.7±2.6 5.4±2.6 11.1±4.7
总体Total 1445.0±201.2 1296.2±207.8 2741.2±379.6 872.9±160.8 771.8±157.3 1644.3±291.7

Table 3

Carbon and nitrogen footprints of double rice at different cropping scopes in middle and lower reaches of the Yangtze River"

项目
Item
种植规模Cropping scope
种粮大户
Large-scale grain planter (23)
家庭农场
Family farm (13)
一般农户
General farmer (40)
碳足迹Carbon footprint (kgCO2-eq/kg) 0.53±0.03c 0.62±0.05b 0.80±0.10a
氮足迹Nitrogen footprint (gN-eq/kg) 6.73±1.53c 9.67±1.11b 12.04±1.13a

Fig.4

Relationship of actual yield of rice and irrigation amount and N fertilizer input"

Table 4

Coefficient estimates and marginal effects of the Poisson regression model"

解释变量
Explaining variable
碳足迹Carbon footprint 氮足迹Nitrogen footprint
回归系数
Coefficient of estimate
边际效应
Marginal effect
回归系数
Coefficient of estimate
边际效应
Marginal effect
性别Gender 0.115(0.058) 0.018(0.009) 0.216(0.108) 0.033(0.017)
年龄Age 0.061(0.031)* 0.009(0.005)* 0.044(0.022)** 0.007(0.003)**
教育Education -0.330(-0.165)* -0.063(-0.032)** -0.345(-0.173)* -0.066(-0.033)*
耕作年限Experience -0.052(-0.026) -0.008(-0.004) -0.033(-0.017) -0.005(-0.003)
耕作面积Farm size -0.053(-0.027)* -0.008(-0.004)* -0.067(-0.034)* -0.010(-0.005)*
气候变化认知Climate change awareness -0.040(-0.020) -0.006(-0.003) -0.058(-0.029) -0.009(-0.005)
低碳绿色认知Low carbon awareness -0.336(-0.168)* -0.053(-0.027)** -0.412(-0.206)* -0.065(-0.033)*
风险规避意识Risk aversion -0.182(-0.091) -0.028(-0.014) -1.303(-0.652) -0.201(-0.101)
农业收入比例Farm income ratio 0.162(0.081) 0.026(0.013) 0.173(0.087) 0.027(0.014)
机械拥有量Machinery ownership -0.173(-0.087)* -0.028(-0.014)* -0.048(-0.024)* -0.008(-0.004)*
土壤肥力状况Soil fertility deficiency -0.229(-0.115)* -0.038(-0.019)** -0.121(-0.061)* -0.020(-0.011)*
灌溉条件Sufficient water irrigation -0.220(-0.110)*** -0.037(-0.018)** -0.145(-0.073)** -0.024(-0.012)**
信贷途径Credit access 0.113(0.057) 0.019(0.010) 0.159(0.080) 0.027(0.014)
技术支持Technical support -0.350(-0.175)*** -0.061(-0.031)** -0.341(-0.171)*** -0.060(-0.031)***
[1] Stocker T F, Qin D, Plattner G K, et al. Climate Change 2013:The Physical science basis. Contribution of working group I to the fifth assessment report of the intergovernmental panel on climate change. Cambridge University Press,Cambridge,United Kingdom and New York,NY,USA, 2013.
[2] 方恺. 足迹家族:概念、类型、理论框架与整合模式. 生态学报, 2015, 35(6):1-17.
[3] WRI. The greenhouse gas protocol initiative:the foundation for sound and sustainable climate strategies. World Resources Institute and World Business Council for Sustainable Development, 2009.
[4] Pierer M, Winiwarter W, Leach A M, et al. The nitrogen footprint of food products and general consumption patterns in Austria. Food Policy, 2014, 49(1):128-136.
doi: 10.1016/j.foodpol.2014.07.004
[5] Linquist B, Groenigen K J V, Adviento-Borbe M A, et al. An agronomic assessment of greenhouse gas emissions from major cereal crops. Global Change Biology, 2015, 18(1):194-209.
doi: 10.1111/j.1365-2486.2011.02502.x
[6] Gao B, Ju X T, Zhang Q, et al. New estimates of direct N2O emissions from Chinese croplands from 1980 to 2007 using localized emission factors. Biogeosciences,2011, 8(10):3011- 3024.
doi: 10.5194/bg-8-3011-2011
[7] Xu X, Lan Y. Spatial and temporal patterns of carbon footprints of grain crops in China. Journal of Cleaner Production, 2017, 146 (10):218-227.
doi: 10.1016/j.jclepro.2016.11.181
[8] 米松华, 黄祖辉, 朱奇彪, 等. 农户低碳减排技术采纳行为研究. 浙江农业学报, 2014, 26(3):797-804.
[9] 刘乃栋, 胡浩, 胡中应, 等. 江苏省水稻生产的碳排放结构特征和影响因素研究——基于农户生产投入和规模的视角. 安徽农业科学, 2014, 42(13):4121-4124.
[10] IPCC. 2006 IPCC guidelines for national greenhouse gas inventories programme (Hayama,Kanagawa). Japan,2006.
[11] 肖玉. 中国稻田生态系统服务功能及其经济价值研究. 北京: 中国科学院地理科学与资源研究所, 2005.
[12] 薛建福. 耕作措施对南方双季稻田碳、氮效应的影响. 北京: 中国农业大学, 2015.
[13] Xue J F, Pu C, Liu S L, et al. Carbon and nitrogen footprint of double rice production in southern China. Ecological Indicators, 2016, 64:249-257.
doi: 10.1016/j.ecolind.2016.01.001
[14] ISO 14044. Environmental management-life cycle assessment- requirements and guidelines. International Organization for Standardization, 2006.
[15] Guinée J B, Gorrée M, Heijungs R, et al. Life cycle assessment: an operational guide to the ISO Standards. Kluwer Academic Publishers,Dordrecht,The Netherlands, 2002.
[16] Cheng K, Pan G X, Smith P, et al. Carbon footprint of China's crop production-an estimation using agro statistics data over 1993-2007. Agriculture Ecosystems Environment, 2011, 142:231-237.
doi: 10.1016/j.agee.2011.05.012
[17] Xue X B, Landis A E. Eutrophication potential of food consumption patterns. Environmental Science and Technology. 2010, 44(16):6450-6456.
doi: 10.1021/es9034478 pmid: 20704246
[18] Leip A, Weiss F, Lesschen J P, et al. The nitrogen footprint of food products in the European Union. Journal of Agricultural Science and Technology, 2014, 152:20-33.
[19] Wang C, Zhou W, Li Z Z, et al. Effects of different nitrogen application rates on ammonia volatilization from paddy fields under double-harvest rice system. Plant nutrition and fertilizer Science, 2012, 18(2):349-358.
[20] Sutton M A, Oenema O, Erisman J W, et al. Too much of a good thing. Nature, 2011, 472(7342):159-161.
doi: 10.1038/472159a
[21] Chen Z, Fu C, Zhang H, et al. Effects of nitrogen application rates on net annual global warming potential and greenhouse gas intensity in double-rice cropping systems of the Southern China. Environmental Science and Pollution Research, 2016, 23(24):24781-24795.
doi: 10.1007/s11356-016-7455-x
[22] Feng S, Tan S, Zhang A, et al. Effect of household land management on cropland topsoil organic carbon storage at plot scale in a red earth soil area of South China. Journal of Agricultural Science, 2011, 149:557-566.
pmid: 22505775
[1] Zhang Jun, Deng Dasun, Liu Jianjun, Zhou Wenxi, Huang Qianru, Zhang Weijian. Mechanization Cultivation Model of Ratoon Rice with Straw Incorporation in Double Rice Cropping Region in South of Yangtze River Valley [J]. Crops, 2021, 37(4): 212-216.
Viewed
Full text


Abstract

Cited

  Shared   
  Discussed   
No Suggested Reading articles found!