Crops ›› 2025, Vol. 41 ›› Issue (6): 91-99.doi: 10.16035/j.issn.1001-7283.2025.06.012
Previous Articles Next Articles
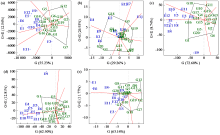
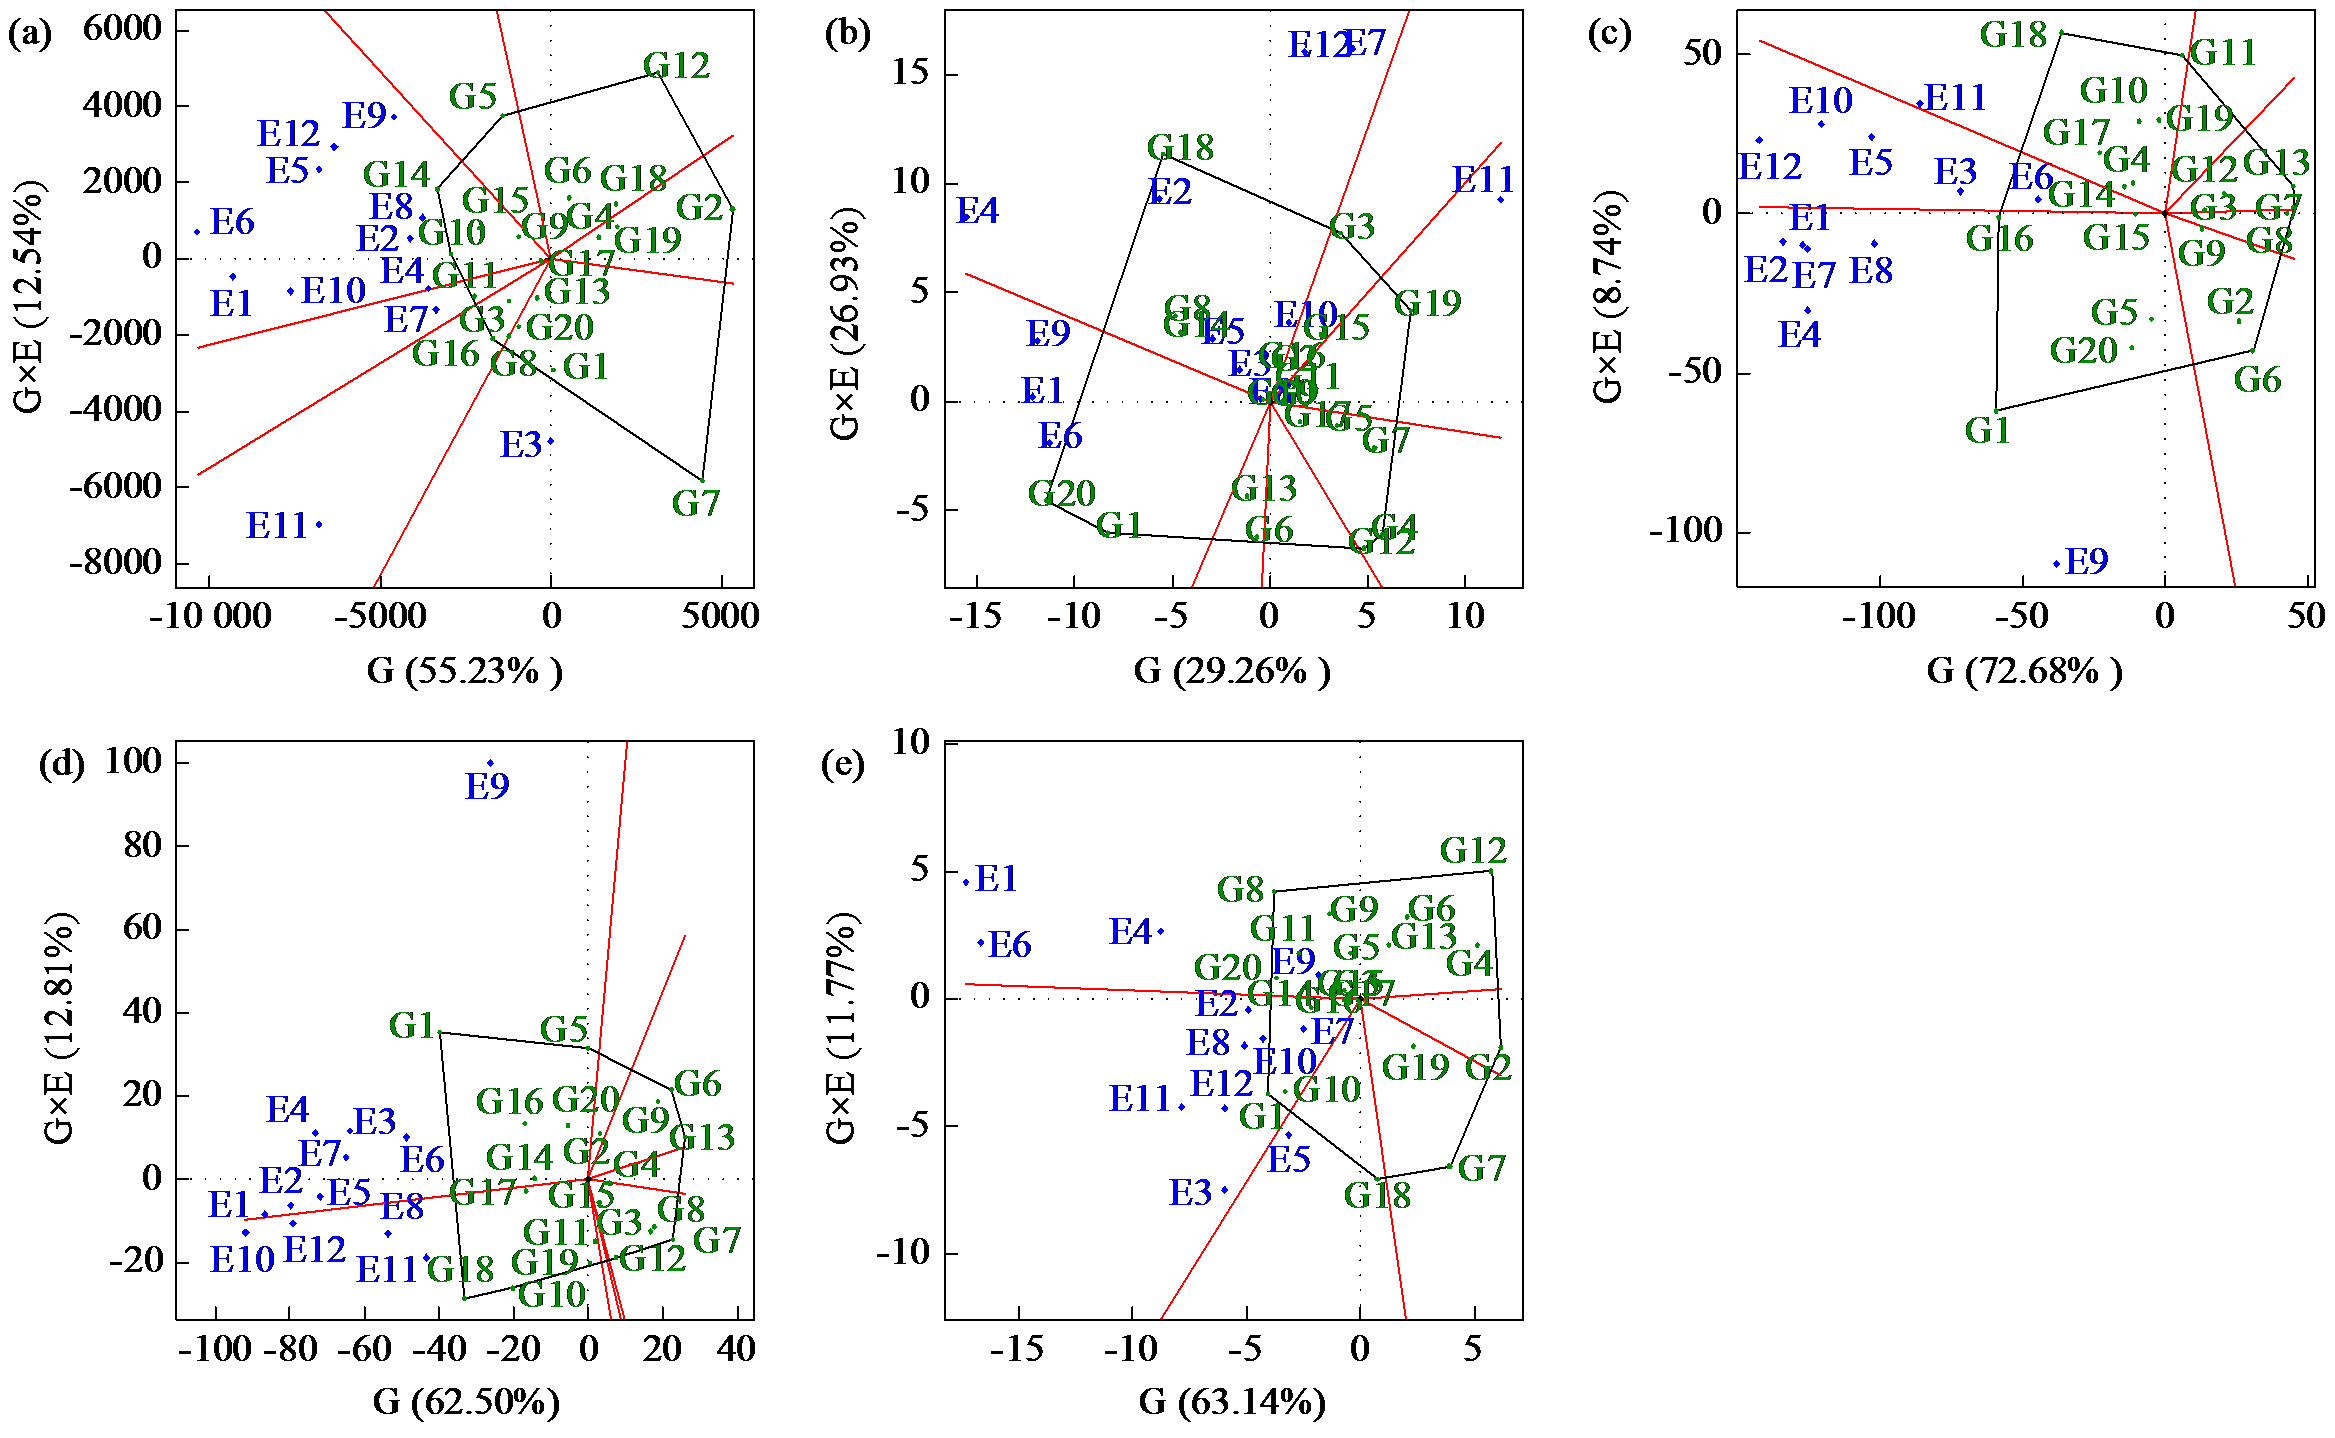
Analysis of Genotype and Environmental Interaction Effects of New Silage Corn Varieties in Henan Province
Chen Guoli1( ), Xu Chaofeng1, Wei Changmin1, Wang Ruyin1, Zhang Yanfang1, Li Haoyuan2, Zhang Jun3()
- 1
Zhoukou Academy of Agricultural Sciences Zhoukou 466000, Henan, China
2Kaifeng Academy of Agriculture and Forestry Sciences Kaifeng 475004, Henan, China
3Zhumadian Agricultural Technology Extension and Plant Protection Quarantine Station Zhumadian 463200, Henan, China
| [1] | 苏胜宇, 王长里, 周禹, 等. 唐山地区青贮玉米筛选与机械化种植栽培技术. 现代农村科技, 2024(5):108-109. |
| [2] | 姚海梅, 王芳, 方永丰, 等. 甘肃省玉米区域试验品系产量稳定性及试点代表性分析. 甘肃农业大学学报, 2016, 51(6):17-23. |
| [3] |
张恺东, 张凡巧, 董博, 等. 基于R语言的AMMI模型和GGE双标图在大豆区试中的应用评价. 中国农学通报, 2024, 40 (13):140-145.
doi: 10.11924/j.issn.1000-6850.casb2023-0388 |
| [4] | 岳海旺, 卜俊周, 魏建伟, 等. AMMI模型与BLUP方法相结合评价河北省冬小麦品种丰产性和稳定性. 中国农业大学学报, 2024, 29(8):50-61. |
| [5] | 常世豪, 王金霞, 耿臻, 等. 基于AMMI和GGE模型对大豆区域试验进行综合评价. 分子植物育种. (2024-05-09)[2024-07-22]. https://link.cnki.net/urlid/46.1068.s.20240508.1538.008. |
| [6] | 穆兰海, 常克勤, 杜燕萍, 等. AMMI模型和GGE双标图对宁夏不同气候类型区苦荞品种稳产性适应性分析. 黑龙江农业科学, 2024(2):8-14. |
| [7] | 万星, 刘燚, 肖本泽. 基于AMMI模型和GGE双标图分析长江中下游水稻区试品种的适应性. 中南农业科技, 2024, 45(1):7-11,25. |
| [8] | 赵长延, 段维, 朱志锋, 等. 基于AMMI模型和GGE双标图对油用向日葵多点试验稳定性和适应性分析. 干旱区资源与环境, 2023, 37(11):123-131. |
| [9] | 江婉玥, 胡晓航, 马亚怀, 等. 基于AMMI模型和GGE双标图在甜菜品种区试中的应用. 分子植物育种. (2023-03-27) [2024-07-22]. https://link.cnki.net/urlid/46.1068.s.20230324.1716.006. |
| [10] | 鲁月, 张子惠, 陆洲, 等. 基于AMMI模型和GGE双标图对江苏省甜玉米区域试验的分析. 分子植物育种, 2022, 20(20):6939-6946. |
| [11] | 步清, 鲁月, 郝德荣, 等. AMMI模型和GGE双标图在江苏省糯玉米品种区域试验中的应用. 分子植物育种, 2022, 20 (22):7628-7636. |
| [12] | 朱艳彬, 樊晓琴, 吉闻天, 等. 基于AMMI模型和GGE双标图的西北春玉米品种区域试验综合评价. 中国农业大学学报, 2023, 28(12):15-24. |
| [13] | 李雪, 丁逸帆, 左示敏, 等. 基于AMMI模型和GGE双标图对2018年江苏省水稻杂交中粳品种区域试验结果的评价分析. 杂交水稻, 2021, 36(3):96-102. |
| [14] | 魏常敏, 许卫猛, 邢永锋, 等. 黄淮海糯玉米品种基因型与环境互作效应分析. 南方农业学报, 2021, 52(4):888-896. |
| [15] | 中华人民共和国农业农村部. 农作物品种试验与信息化技术规程玉米:NY/T 1209-2020. 北京: 中国农业出版社, 2020. |
| [16] | 中华人民共和国国家卫生健康委员会. 食品安全国家标准食品中淀粉的测定:GB 5009.9-2023. 北京: 中国农业出版社, 2023. |
| [17] | 国家市场监督管理总局. 饲料中中性洗涤纤维(NDF)的测定:GB/T 20806-2022. 北京: 中国农业出版社, 2022. |
| [18] | 中华人民共和国农业农村部. 饲料中酸性洗涤纤维的测定:NY/T 1459-2022. 北京: 中国农业出版社, 2022. |
| [19] | 国家市场监督管理总局. 饲料中粗蛋白的测定凯氏定氮法:GB/T 6432-2018. 北京: 中国农业出版社, 2018. |
| [20] | 张泽, 鲁成, 向仲怀. 基于AMMI模型的品种稳定性分析. 作物学报, 1998, 24(3):304-309. |
| [21] | 唐启义. 实用统计分析及其DPS数据处理系统. 北京: 科学出版社, 2002. |
| [22] | 苗建利, 邓丽, 郭敏杰, 等. 基于BLUP和GGE双标图的全国北方片花生区域试验分析. 分子植物育种, 2024, 22(3):832-839. |
| [23] | 张晓申, 杨育峰, 雒峰, 等. GGE双标图对甘薯‘郑红23号’丰产稳产性和适应性的评价. 分子植物育种. (2024-02-21) [2024-07-22]. https://link.cnki.net/urlid/46.1068.S.20240221.1431.004. |
| [24] | 邹景伟, 黄丙欣, 黄宏宇, 等. 国审玉米新品种泊玉26的丰产性、稳产性及适应性分析. 种子, 2023, 42(10):129-133,138. |
| [25] |
Gauch H G J, Piepho H, Annicchiarico P. Statistical analysis of yield trials by AMMI and GGE: further considerations. Crop Science, 2008, 48(3):866-889.
doi: 10.2135/cropsci2007.09.0513 |
| [26] | 魏鹏程, 陈杜, 罗英舰, 等. 基于AMMI和GGE双标图的贵州不同生态区春玉米丰产性稳产性和试点辨别力评价. 玉米科学, 2023, 31(1):22-31. |
| [27] |
Yan W K, Tinker N A. Biplot analysis of multi-environment trial data: principles and applications. Canadian Journal of Plant Science, 2006, 86(3):623-645.
doi: 10.4141/P05-169 |
| [28] | 王虎宁, 秦伟娜, 焦婷, 等. 甘肃不同青饲玉米品种产量、农艺性状及营养品质评定. 草业科学, 2023, 40(6):1617-1628. |
| [29] |
郭江, 瓮巧云, 宋亚菲, 等. 不同肥料配施对青贮玉米产量和品质的影响. 中国农学通报, 2021, 37(27):21-26.
doi: 10.11924/j.issn.1000-6850.casb2020-0753 |
| [1] | Chen Zhihao, Wang Ting, Chang Xuhong, Wang Yanjie, Liu Xiwei, Yang Yushuang, Wang Yujiao, Wang Demei, Zhao Guangcai. Comprehensive Analysis of Yield and Quality Traits of Wheat Lines in the Northern Huang-Huai Winter Wheat Region [J]. Crops, 2025, 41(6): 148-155. |
| [2] | Qin Nana, Huang Linhua, Chen Ying, Wang Shengmou, Xie Yong, Miao Kai, Li Wanming, Qi Lan. Effects of Foliar Propionyl Brassinolide Application on Photosynthesis, Agronomic Traits and Yield of Summer Soybean [J]. Crops, 2025, 41(6): 164-171. |
| [3] | Yan Xiaowen, Liang Junchao, Zeng Pan, Zhou Hongying, Wang Zhiqi, Le Meiwang, Sun Jian. Effects of Late Sowing on Main Agronomic Traits and Yield of Autumn Sesame [J]. Crops, 2025, 41(6): 189-194. |
| [4] | Zhao Caixia, Baima Yangzhen, Yang Guanghuan, Tang Lin. Identification and Cluster Analysis of Agronomic Traits in Different Types of Rapeseed Resources [J]. Crops, 2025, 41(5): 120-127. |
| [5] | Dong Yang, Yan Feng, Zhao Fuyang, Hou Xiaomin, Li Qingquan, Li Qingchao, Liu Yue, Lan Ying, Yang Huiying, Wang Bingxue, Xu Yan. Effects of Different Herbicide Application Schemes on Foxtail Millet Growth and Soil Microorganisms [J]. Crops, 2025, 41(4): 238-244. |
| [6] | He Bing, Wang Xiaohang, Li Chao, Luo Liqiang, Zhang Qiang, Han Kangshun, Chen Dianyuan, Yan Guangbin, Liu Zhenjiao. Data Analysis of Approved Rice Varieties in Jilin Province from 1987 to 2022 [J]. Crops, 2025, 41(3): 16-22. |
| [7] | Zhang Shengchang, Wei Yuming, Ma Lina, Yang Zhao, Liu Wenyu, Huang Jie, Liu Huan, Yang Farong. Effects of Planting Density and Fertilization on Growth Characteristics of Forage Quinoa [J]. Crops, 2025, 41(2): 128-134. |
| [8] | Zhao Fuyang, Ma Bo, Hu Jifang, Tan Kefei, Liu Chuanzeng, Yan Feng, Dong Yang, Hou Xiaomin, Li Qingquan, Han Yehui. Evaluation of Photoperiod Sensitivity of Japonica Rice in Cold Regions under Different Photoperiod Conditions [J]. Crops, 2025, 41(2): 135-140. |
| [9] | Ji Jinghong, Liu Shuangquan, Ma Xingzhu, Hao Xiaoyu, Zheng Yu, Zhao Yue, Wang Xiaojun, Kuang Enjun. Effects of Different Controlled-Release Urea on Agronomic Traits, Yield and Nitrogen Use Efficiency of Cold Region Rice [J]. Crops, 2025, 41(2): 149-154. |
| [10] | Lu Jing, Yu Bo, Jiang Mi, Peng Lianxin, Ren Yuanhang, Wu Qi. Assessment of Genetic Diversity in 58 Germplasm Resources of Highland Barley [J]. Crops, 2025, 41(2): 20-28. |
| [11] | Luo Jianke, Zhang Kehou, Wang Zeyu, Zhang Pingzhen, Nan Ming. Research on the Production Performance of 18 Oat Varieties (Lines) in the Irrigation Area along the Yellow River in Baiyin City [J]. Crops, 2025, 41(2): 93-100. |
| [12] | Yang Ruping, Jia Zhen, Wei Ying, Wei Yechou, Wang Liming, Chen Guangrong, Zhang Guohong, Song Wenwen. The Relationship between the Growth Period Traits of Soybean Varieties from Various Regions of Gansu and Meteorological Factors as well as Agronomic Traits [J]. Crops, 2025, 41(1): 123-132. |
| [13] | Yan Qunxiang, Pang Yuhui, Hong Zhuangzhuang, Bi Junge, Wang Chunping. Genetic Diversity Analysis and Specificity Evaluation of Main Traits of 141 Wheat Germplasm Resources at Domestic and Foreign [J]. Crops, 2025, 41(1): 26-34. |
| [14] | Sun Mingmao, Liu Lixia, Sun Hu, Cui Di. Analysis of Anthocyanin and Important Agronomic Traits in a Population of Recombinant Inbred Lines of Rice [J]. Crops, 2024, 40(6): 26-38. |
| [15] | Ma Lina, Wei Yuming, Wen Lifang, Zhang Xuejian, Yang Zhao, Huang Jie, Zhang Shengchang, Li Xiaoyu, Liu Huan, Yang Farong. Analysis of Agronomic Traits and Nutritional Quality of 22 Quinoa Germplasms in Yuanmou Area of Yunnan Province [J]. Crops, 2024, 40(6): 47-54. |
|
||