


开放科学(资源服务)标识码(OSID): 
大豆灰斑病(Cercospora sojina)于1921年在我国首次发现后,在国内各大豆种植区均有不同程度的发生,并且在我国北方春大豆产区发生最为严重,直接导致大豆品质降低,产量损失超过60%[1]。大豆灰斑病病菌为半知菌亚门真菌,具有明显的生理分化现象,如Pham等[2]用16个鉴别寄主鉴定出11个生理小种;Mian等[3]用10个鉴别寄主鉴定出22个生理小种;丁俊杰等[4]用6个鉴别寄主鉴定出15个生理小种。我国的灰斑病1号生理小种是北方春大豆产区的第一优势小种[5],2006-2010年黑龙江省大豆灰斑病生理小种的检测结果表明,其在各大豆主产区出现频率最高,为50.5%,平均为40.1%[6]。
选育抗病品种是防治大豆灰斑病的有效方法。利用分子技术了解不同等位基因的作用,高效利用不同种质资源的有益等位基因,在常规育种或分子育种中有目的地聚合或替代,甚至可以通过分子设计提高育种效率[7]。以群体连锁不平衡为基础的关联分析是发掘携带优异等位变异和载体材料的定位方法。在大豆抗病性研究中,Sun等[8]利用SSR标记通过关联分析鉴定了与大豆疫霉抗性相关的4个抗性位点;魏崃等[9]利用150份大豆品种与256对SSR标记进行关联分析找到差异显著的关联等位变异位点12个,获得了对每个小种具有不同抗性的大豆材料;冯莉君[10]利用300份种质资源对大豆胞囊线虫4号生理小种的鉴定发现了1个新抗源,关联分析发现了与之相关联的4个连锁标记。
本研究以205份大豆种质资源为试验材料,通过人工接种灰斑病1号生理小种进行抗性鉴定,利用117对SSR标记发掘大豆资源中抗灰斑病1号生理小种的优异等位变异和携带优异等位变异载体材料,为培育抗灰斑病品种提供遗传信息和理论基础。
1 材料与方法
1.1 供试材料
选取黑龙江省育成大豆品种96份、外省育成大豆品种34份、地方大豆品种13份和野生大豆资源62份为供试材料(表1)。
表1 不同来源的205份大豆资源
Table 1
| 类型Type | 来源Origin | 材料Material |
|---|---|---|
| A | 黑龙江省育成品种 (96份) | 北豆5, 合丰16, 合丰23, 合丰25, 合丰29, 合丰32, 合丰34, 合丰36, 合丰39, 合丰41, 合丰42, 合丰44, 合丰47, 合丰50, 合丰51, 合丰52, 合丰53, 合丰54, 合丰55, 合丰56, 合农59, 合农61, 黑农37, 黑农40, 黑农44, 黑农48, 黑农51, 黑农52, 黑农58, 黑农68, 华疆2, 华疆4号, 金源55, 垦豆18, 垦丰14, 垦丰16, 垦丰17, 垦丰20, 垦丰22, 垦丰23, 垦农26, 垦农28, 绥农22, 绥农24, 北丰11, 北丰14, 北疆1号, 东农42, 东农43, 东农47, 东农48, 东农49, 东农50, 东农51, 东农52, 东农53, 东农55, 丰收06, 丰收24, 丰收25, 合丰05, 合丰22, 合丰30, 合丰35, 合丰40, 合丰45, 合丰57, 合农62, 合农63, 黑河10, 黑河11, 黑河12, 黑河14, 黑河15, 黑河16, 黑河18, 黑河19, 黑河20, 黑河21, 黑河22, 黑河23, 黑河24, 黑河25, 黑河26, 黑河39, 黑河43, 黑河44, 黑河49, 黑河50, 黑河51, 黑农69, 绥农4号, 绥农25, 绥农31, 红丰3, 垦豆25 |
| B | 外省育成品种 (34份) | 吉林1, 吉林2, 吉林11, 吉林12, 吉林14, 吉林17, 吉林18, 吉林19, 吉林25, 吉林28, 吉林29, 吉林30, 吉林32, 安丰1, 九农1, 九农2, 九农9, 白农1, 铁丰5, 铁丰22, 铁丰25, 辽豆3, 丹豆1, 丹豆2, 开育8, 通农8, 紫花4, 通农4, 长农5, 吉育95, 长农18, 长农24, 长农26, 长农27 |
| C | 地方品种 (13份) | 小白脐, 满地金, 玉石豆, 牛毛青, 一窝蜂, 黄毛豆, 龙油太, 黑滚豆, 茶色豆, 青扎豆, 蓑衣领, 嘟噜豆, 元宝金 |
| D | 野生资源 (62份) | 12C6211, 12C8757, 12C8760, 12C6208, 11C2638, 12NC1844, 12C8745, 12NC1806, 12NC1846 , 12NC1808, 12C8607, 12C6002, 12NC1848, 12NC1810, 12NC1854, 12C8619, 12NC1812, 12C8670, 12C8643, 12C8646, 12C6181, 12C6175, 12C8697, 12C8649, 12C8603, 12C8592, 12NC1838, 12NC1820, 12NC1822, 12C8631, 12C8595, 12C8769, 12C8598, 12C8601, 12C8721, 12NC1818, 12NC1816, 12NC1864, 12NC1814, 12NC1860, 12NC1858, 12C6166, 12NC1834, 12C8742, 12C5984, 12NC1842, 12NC1802, 12NC1804, 12C8589, 12C8766, 12NC1866, 12C8772, 12C8709, 12C6214, 12C8604, 12C6169, 12C8667, 12NC1852, 12C6061, 12C8625, 12C6277, 12NC1836 |
1.2 试验方法
表2 大豆灰斑病鉴定分级标准
Table 2
| 分级 Grade | 病情指数 Disease index | 抗性评价 Resistance evaluation |
|---|---|---|
| 1 | 0~20 | 高抗(HR) |
| 2 | 21~40 | 抗病(R) |
| 3 | 41~60 | 中抗(MR) |
| 4 | 61~80 | 感病(S) |
| 5 | 80以上 | 高感(HS) |
图1
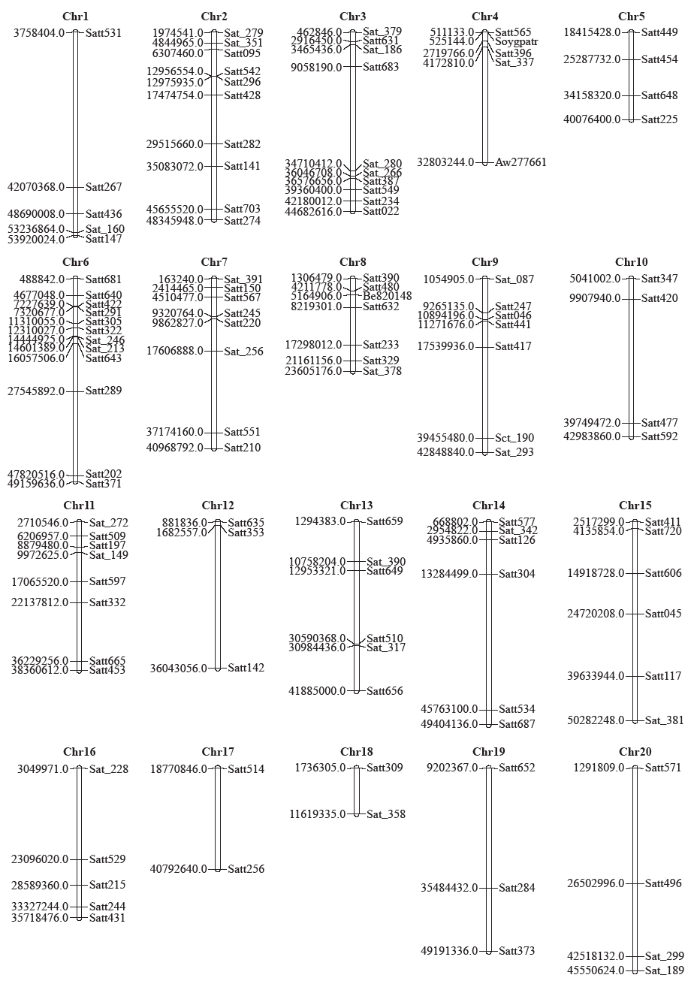
图1
117对SSR标记在大豆染色体上的分布
Fig.1
Distribution of 117 SSR markers on the chromosomes of soybean
1.2.3 PCR扩增及电泳 PCR扩增为10μL反应体系,含1.0μL buffer、0.2μL的dNTP、1.5μL的正反SSR引物、0.1μL Taq聚合酶、1.5μL的DNA模板和5.7μL的去离子水。PCR反应程序为94℃预变性5min;94℃变性30s,42℃~61℃退火30s,72℃延伸30s,35个循环;72℃延伸5min。反应产物于4℃保存。PCR扩增产物在8%聚丙烯酰胺凝胶中分离,采用银染法[17]显色。
1.3 数据分析
1.3.1 遗传多样性及群体结构 利用PowerMarker version 3.25软件[18]计算117对SSR标记的等位基因数、基因多样性和多态信息含量(PIC)。基于Bayesian模型,利用Structure 2.2软件[19]对205份大豆资源进行群体结构分析,将亚群数目(K)设置为1~9,Markov Chain Monte Carlo(MCMC)开始时的不作数迭代长度(length of burn-in period)设为10 000次,再将不作数迭代后的MCMC设为100 000次,各独自运行5次计算Q值。依据似然值最大原则选取合适K值,如果出现LnP(D)随群体数增加而增加,无法确定最适亚群数情况,则通过计算∆K来确定K的最优亚群数[20]。
1.3.2 聚类热图 采用NTSYS 2.0软件计算205份大豆资源的遗传相似性系数(genetic similarity,GS),以材料间的遗传距离(genetic distance,GD)(GD=1-GS)为基础,运用MeV软件的层次聚类法(hierarchical clustering)对205份大豆资源群体进行聚类热图分析。
2 结果与分析
2.1 灰斑病1号生理小种抗性鉴定分析
205份大豆资源对灰斑病1号生理小种的抗性鉴定结果(表3)表明:高抗资源1份,占供试材料0.49%;抗病资源40份,占供试材料19.51%;中抗资源100份,占供试材料48.78%;感病资源63份,占供试材料30.73%;高感资源1份,占供试材料0.49%。病情指数变化范围12%~82%,其中地方品种青扎豆的病情指数最高(82%),黑龙江育成品种东农43的病情指数最低(12%)。病情指数总平均值为54.16%,平均变异系数为20.90%。
表3 不同来源大豆资源抗性鉴定结果
Table 3
| 来源 Origin | 数量 No. | HR | R | MR | S | HS | 病情指数范围 Range of disease index (%) | 平均值 Average (%) | 变异系数 Coefficient of variation (%) |
|---|---|---|---|---|---|---|---|---|---|
| A | 96 | 1 | 22 | 53 | 20 | 0 | 12~72 | 52.17 | 21.76 |
| B | 34 | 0 | 1 | 15 | 18 | 0 | 40~68 | 59.41 | 9.61 |
| C | 13 | 0 | 2 | 4 | 6 | 1 | 22~82 | 57.54 | 24.87 |
| D | 62 | 0 | 15 | 28 | 19 | 0 | 28~68 | 53.66 | 22.47 |
从表3发现,病情指数在4种不同来源的群体中存在差异,地方品种(C)变异系数最大(24.87%);外省育成品种(B)变异系数最小(9.61%)。从4种不同来源群体病情指数平均值可以看出,黑龙江育成品种(A)和野生资源(D)抗病性相对较好,外省育成品种(B)和地方品种(C)抗病性较弱。
2.2 SSR位点遗传多样性分析
117对SSR标记均具有多态性,在全部大豆资源中共检测出1 420个等位变异,不同位点的等位变异数变幅为5~19,平均每对SSR标记的等位变异数为12.14。标记Satt142、Satt449、Satt341、Satt534和Sat_390的等位变异数最多,为19个;Sat_317、Satt332、Satt291和Sat_087的等位变异数最少,为5个。基因多样性变幅在0.14~0.88之间,平均为0.74;多态性信息含量(PIC)变幅在0.13~0.86之间,平均为0.72。
2.3 亲缘关系值分析
利用SPAGeDi-1.3软件计算两两材料间亲缘关系值频率分布(图2)。两两材料间的亲缘关系值小于0.05的占64.07%,0.05~0.10的占4.29%,0.10~0.15的占7.40%,0.15~0.20的占6.77%,大于0.50的占0.49%,表明205份大豆材料间亲缘关系值普遍偏低,群体间亲缘关系较远。
图2
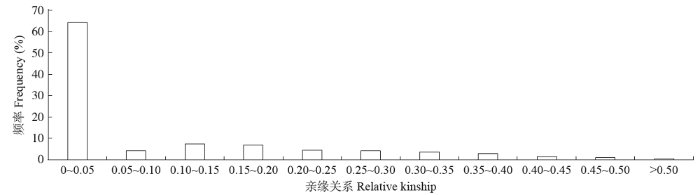
图2
205份大豆资源的亲缘系值分布图
Fig.2
Distribution of relative kinship value of 205 soybean resources
2.4 群体结构
图3
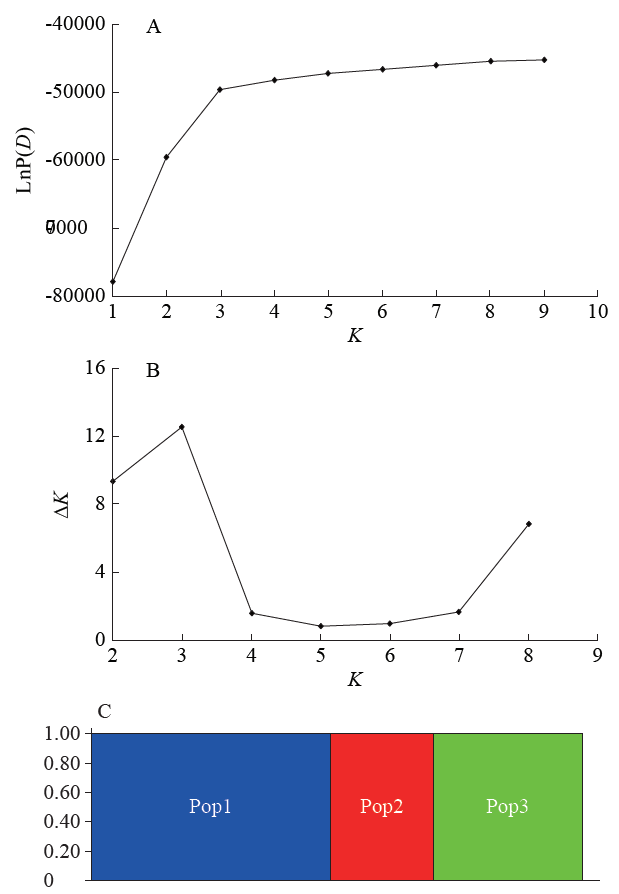
图3
205份大豆资源的群体结构
A:群体的LnP(D)值;B:群体的∆K值;C:群体结构示意图
Fig.3
Population structure of 205 soybean resources
A: Estimation of LnP(D) value in population; B: Estimation of ∆K value in population; C: Group structure diagram
2.5 热图分析
运用MeV软件的层次聚类法对205份大豆资源进行聚类热图分析(图4)。结果显示,按照遗传距离的大小,205份大豆资源被明确的分为3个亚群(Pop1、Pop2和Pop3),分析结果与利用Structure 2.2的群体分析结果一致。
图4
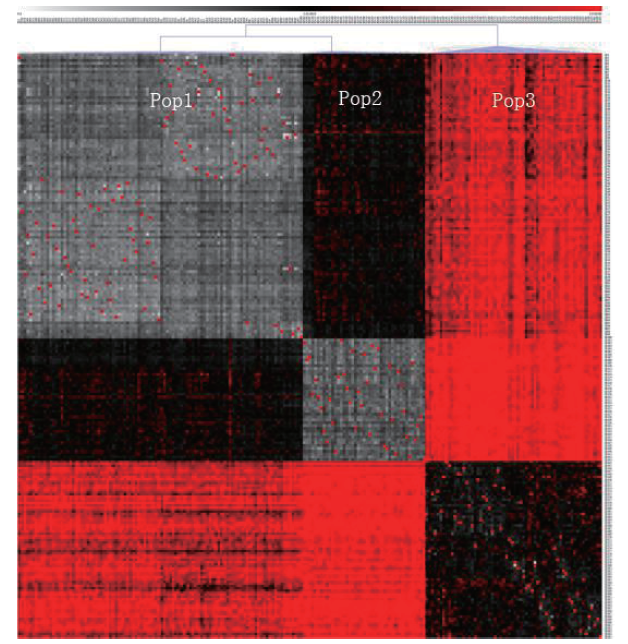
图4
205份大豆资源聚类热图分析结果
Fig.4
Cluster heat map analysis results of 205 soybean resources
2.6 关联分析
利用Tassel 3.0软件中的GLM(Q)和MLM(Q+K)程序进行关联分析(表4)。GLM共检测到7个与大豆灰斑病1号生理小种抗性关联的标记,分布在6条染色体上,表型变异解释率范围在7.58%~16.06%,其中Satt142、Satt431和Satt244对表型变异解释率超过10.00%;MLM只检测到1个与大豆灰斑病1号生理小种抗性关联的标记Satt332,且与GLM模型检测的表型变异解释率一致(9.17%)。
表4 与抗性显著相关的位点及其表型变异解释率
Table 4
| 模型 Model | 位点 Marker | 染色体 Chromosome | 位置 Position | P | R2 (%) |
|---|---|---|---|---|---|
| GLM | Satt387 | 3 | 36 576 654 | 0.0369 | 8.96 |
| Satt233 | 8 | 17 298 012 | 0.0367 | 9.05 | |
| Satt332 | 11 | 22 137 813 | 0.0056 | 9.17 | |
| Satt142 | 12 | 36 043 054 | 0.0189 | 16.06 | |
| Satt309 | 13 | 1 736 305 | 0.0481 | 7.58 | |
| Satt244 | 16 | 33 327 246 | 0.0200 | 13.09 | |
| Satt431 | 16 | 35 718 476 | 0.0421 | 13.58 | |
| MLM | Satt332 | 11 | 22 137 813 | 0.0197 | 9.17 |
2.7 优异等位变异及载体材料
通过对大豆灰斑病1号生理小种抗性显著关联的7个SSR位点进行表型效应值分析(表5)。结果表明,具有增效的效应值大于20的等位变异分别为Satt244-230(效应值26.16),典型载体材料为12C8646;Satt142-154(效应值21.94),典型载体材料为12C8670;Satt244-186(效应值20.19),典型载体材料为12C6175。携带上述3个等位变异的材料均为野生资源。全部育成品种中携带的增效效应值最大的等位变异为Satt142-189(效应值8.94),共有8个材料携带此等位变异,其中1个为野生资源,其余7个均为黑龙江省育成品种,分别为东农43、东农47、合丰45、黑河20、黑河26、黑河43和绥农25。
表5 与抗性显著关联的位点其增效等位变异对应的表型效应
Table 5
| 位点-等位变异 Locus-allele | 表型效应 ai | 材料数 No. | 典型载体材料 Typical material | 位点-等位变异Locus-allele | 表型效应 ai | 材料数 No. | 典型载体材料Typical material |
|---|---|---|---|---|---|---|---|
| Satt332-219 | 16.16 | 7 | 12C8670 | Satt387-211 | 7.19 | 4 | 12C8670 |
| Satt332-248 | 1.37 | 109 | 东农43 | Satt387-235 | 5.52 | 6 | 12NC1820 |
| Satt332-240 | 0.43 | 34 | 12NC1838 | Satt387-209 | 5.32 | 16 | 12C8646 |
| Satt142-154 | 21.94 | 2 | 12C8670 | Satt387-217 | 3.69 | 4 | 12C8667 |
| Satt142-124 | 10.61 | 3 | 12C8721 | Satt387-204 | 2.82 | 19 | 元宝金 |
| Satt142-189 | 8.94 | 8 | 东农43 | Satt387-197 | 1.00 | 101 | 东农43 |
| Satt142-196 | 5.27 | 3 | 12NC1838 | Satt431-265 | 18.16 | 2 | 12C8667 |
| Satt142-165 | 5.08 | 7 | 12NC1820 | Satt431-189 | 12.63 | 4 | 12C6175 |
| satt142-150 | 3.65 | 7 | 12C8646 | Satt431-254 | 9.13 | 2 | 12NC1838 |
| satt142-163 | 1.94 | 3 | 12C6181 | Satt431-234 | 8.51 | 16 | 东农43 |
| Satt142-177 | 0.80 | 93 | 黑农44 | Satt431-220 | 8.13 | 6 | 12C8646 |
| Satt244-230 | 26.16 | 1 | 12C8646 | Satt431-245 | 5.33 | 5 | 12C8670 |
| Satt244-186 | 20.19 | 1 | 12C6175 | Satt431-228 | 0.64 | 82 | 12NC1820 |
| Satt244-178 | 3.22 | 72 | 东农43 | Satt309-134 | 4.34 | 18 | 12C8646 |
| Satt233-204 | 16.21 | 2 | 12C8760 | Satt309-144 | 1.57 | 56 | 黑农48 |
| Satt233-208 | 3.46 | 8 | 12C8646 | Satt309-155 | 1.23 | 10 | 黑河15 |
| Satt233-214 | 3.01 | 25 | 黑农48 | Satt309-138 | 0.70 | 17 | 12C8643 |
| Satt233-220 | 2.88 | 39 | 东农43 | Satt309-147 | 0.32 | 45 | 东农43 |
3 讨论
大豆灰斑病在北方大豆主产区常有发生,灰斑病1号生理小种是黑龙江省产区的优势生理小种,对大豆产量和品质危害较大。在生产调查中发现,灰斑病的发生与品种关系密切,在发病较重的地区推广种植抗灰斑病的品种较少,大部分为中感至感病品种,甚至还有一些高感品种。因此,培育和推广抗灰斑病大豆品种是减少病害损失的有效途径之一。
我国在20世纪80年代开始抗灰斑病大豆品种的选育工作,利用常规育种方法培育了一批具有抗性的品种。随着分子标记技术的发展,对重要农艺性状关联标记的发掘为分子标记辅助选择育种提供了遗传信息,但对灰斑病抗性基因的相关发掘研究不多,对灰斑病1号生理小种抗性遗传分析只有张文慧等[11]利用家系作图群体进行过报道,并在4号染色体上找到了3个与抗性基因连锁的标记,连锁顺序和连锁距离为Satt565-6.2cM-SOYGPATR-6.5cM-Hrcs1-14.7cM-Satt396。
本研究以黑龙江省育成品种、地方品种和野生资源构建关联群体,进行了灰斑病1号生理小种抗性的相关研究,发现大豆资源对灰斑病1号生理小种抗性具有较为广泛的遗传变异;检测到7个与抗性位点关联的分子标记,其中位于12号染色体上的Satt142对表型变异的解释率最大(16.06%);在本研究中检测到与抗性位点关联的Satt244,其与品种Davis携带的抗多个生理小种的Rcs3基因[24]相关联。在发掘到的36个优异等位变异中增效效应值大于20的等位变异有3个,都存在于野生资源中。育成品种中增效效应值最大为8.94,分布在7个黑龙江育成品种中,其中东农43检测到7个具有增效效应的等位变异,表型效应变幅在0.32~8.94。在地方品种中分布的增效效应值均较小。由此推测,野生资源通过长期自然选择,群体中保留了抗灰斑病的基因;而地方材料没有进行过更多的选择,群体的抗病性较弱。
目前,关于灰斑病1号生理小种抗性的遗传分析报道较少,本研究发掘到的抗灰斑病1号生理小种7个SSR标记位点及具有增效表型值的等位变异和载体材料可为培育抗灰斑病1号小种品种提供遗传信息。
4 结论
检测到与灰斑病1号生理小种抗性显著关联的SSR位点7个,分别为Satt142、Satt431、Satt244、Satt332、Satt233、Satt387和Satt309,其中Satt142对表型变异的解释率最大,为16.06%。对灰斑病1号生理小种抗性具有增效作用的等位变异有36个,野生资源中效应值较大的3个等位变异分别为Satt244-230、Satt142-154和Satt244-186,3个典型材料分别为12C8646、12C8670和12C6175;育成品种中具有最大增效值的等位变异为Satt142-189(8.94),典型载体材料为东农43。
参考文献
Fine mapping and characterization of candidate genes that control resistance to Cercospora sojina K. Hara in two soybean germplasm accessions
Frogeye leaf spot of soybean:a review and proposed race designations for isolates of hara
作物分子设计育种
优质、多抗、抗逆和高产作物新品种的选育和推广是实现我国粮食安全的重要途径。目前大多数育种工作仍然建立在表型选择和育种家的经验之上,育种效率低下;另一方面,生物信息数据库积累的数据量极其庞大,由于缺乏必要的数据整合技术,可资育种工作者利用的信息却非常有限。作物分子设计育种将在多层次水平上研究植物体所有成分的网络互作行为和在生长发育过程中对环境反应的动力学行为;继而使用各种“组学”数据,在计算机平台上对植物体的生长、发育和对外界反应行为进行预测;然后根据具体育种目标,构建品种设计的蓝图;最终结合育种实践培育出符合设计要求的农作物新品种。设计育种的核心是建立以分子设计为目标的育种理论和技术体系,通过各种技术的集成与整合,对生物体从基因(分子)到整体(系统)不同层次进行设计和操作,在实验室对育种程序中的各种因素进行模拟、筛选和优化,提出最佳的亲本选配和后代选择策略,实现从传统的“经验育种”到定向、高效的“精确育种”的转化,以大幅度提高育种效率。]]>
Association mapping for partial resistance to Phytophthora sojae in soybean (Glycine max (L.) Merr.)
DOI:10.1007/s12041-014-0383-y
URL
PMID:25189230
[本文引用: 1]

Association mapping is a powerful high-resolution mapping tool for complex traits. The objective of this study was to identify QTLs for partial resistance to Phytophthora sojae. In this study, we evaluated a total of 214 soybean accessions by the hypocotyl inoculation method, and 175 were susceptible. The 175 susceptible accessions were then evaluated for P. sojae partial resistance using slant board assays. The 175 accessions were screened with 138 SSR markers that generated 730 SSR alleles. A subset of 495 SSR loci with minor allele frequency (MAF) >/= 0.05 was used for association mapping by the Tassel general linear model (GLM) and mixed linear model (MLM) programmes. This soybean population could be divided into two subpopulations and no or weak relatedness was detected between pairwise accessions. Four SSR alleles, Satt634-133, Satt634-149, Sat_222-168 and Satt301-190, associated with partial resistance to P. sojae were detected by both GLM and MLM methods. Of these identified markers, one marker, Satt301, was located in regions where P. sojae resistance QTL have been previously mapped using linkage analysis. The identified markers will help to understand the genetic basis of partial resistance, and facilitate future marker-assistant selection aimed to improve resistance to P. sojae and reduce disease-related mortality in soybean.
Isolation of plant DNA from fresh tissue
DOI:10.1103/PhysRevFocus.12.13 URL [本文引用: 1]
6个水稻杂交组合与其亲本的SSR标记多态性及其应用
选用分布于水稻12条染色体上的40对SSR引物对6个杂交水稻组合及其亲本的幼苗进行了SSR等位基因多态性分析.结果表明,位点RM224能够鉴别所有试验品种的F1及其亲本;Ⅱ优084和丰两优1号的F1及其双亲各有3对SSR引物可以区分;两优培九F1及其双亲有4对SSR引物可以区分.用位点RM224的引物对1份人为掺杂的两优培九F1样品进行了鉴定,试验结果与样本混合比例结果一致.
Muse Power Marker:an integrated analysis environment for genetic marker analysis
DOI:10.1093/bioinformatics/bti282
URL
PMID:15705655
[本文引用: 1]
SUMMARY: PowerMarker delivers a data-driven, integrated analysis environment (IAE) for genetic data. The IAE integrates data management, analysis and visualization in a user-friendly graphical user interface. It accelerates the analysis lifecycle and enables users to maintain data integrity throughout the process. An ever-growing list of more than 50 different statistical analyses for genetic markers has been implemented in PowerMarker. AVAILABILITY: www.powermarker.net
Inference of population structure using multilocus genotype data
We describe a model-based clustering method for using multilocus genotype data to infer population structure and assign individuals to populations. We assume a model in which there are K populations (where K may be unknown), each of which is characterized by a set of allele frequencies at each locus. Individuals in the sample are assigned (probabilistically) to populations, or jointly to two or more populations if their genotypes indicate that they are admixed. Our model does not assume a particular mutation process, and it can be applied to most of the commonly used genetic markers, provided that they are not closely linked. Applications of our method include demonstrating the presence of population structure, assigning individuals to populations, studying hybrid zones, and identifying migrants and admixed individuals. We show that the method can produce highly accurate assignments using modest numbers of loci-e.g. , seven microsatellite loci in an example using genotype data from an endangered bird species. The software used for this article is available from http://www.stats.ox.ac.uk/ approximately pritch/home. html.
Detecting the number of clusters of individuals using the software STRUCTURE:a simulation study
TASSEL:software for association mapping of complex traits in diverse samples
DOI:10.1093/bioinformatics/btm308
URL
PMID:17586829
[本文引用: 1]
Association analyses that exploit the natural diversity of a genome to map at very high resolutions are becoming increasingly important. In most studies, however, researchers must contend with the confounding effects of both population and family structure. TASSEL (Trait Analysis by aSSociation, Evolution and Linkage) implements general linear model and mixed linear model approaches for controlling population and family structure. For result interpretation, the program allows for linkage disequilibrium statistics to be calculated and visualized graphically. Database browsing and data importation is facilitated by integrated middleware. Other features include analyzing insertions/deletions, calculating diversity statistics, integration of phenotypic and genotypic data, imputing missing data and calculating principal components.
SPAGeDi:a versatile computer program to analyse spatial genetic structure at the individual or population levels
DOI:10.1046/j.1471-8286.2002.00305.x URL [本文引用: 1]
中国栽培和野生大豆农艺品质性状与SSR标记的关联分析Ⅱ. 优异等位变异的发掘
DOI:10.3724/SP.J.1006.2008.01339
URL
[本文引用: 1]
在前文研究已检出与农艺品质性状显著关联的SSR位点的基础上, 本文进一步对与性状关联位点的等位变异作解析, 通过将携带某等位变异的所有材料表型均值与携带无效等位基因( allele)材料表型均值做比较, 估计等位变异的潜在表型效应增量(减量), 进一步利用该信息估计位点增效(减效)等位变异的平均效应, 鉴别出一批农艺品质性状优异位点、等位变异及携带优异等位变异的载体材料。发现在栽培及野生种质中检出的优异等位变异有同、有异、有互补性。发现关联位点正、负效应等位变异均值间有差异, 可根据育种目标性状选择要求, 选取适合的位点及相应等位变异。同一标记位点可与多性状关联, 其等位变异在不同性状间各有其表型效应的方向和大小; 等位变异在相关性状效应上方向、大小的异同解释了性状间正、负相关的遗传原因。关联作图得到的信息可以弥补家系连锁法QTL定位信息的不足, 并直接利用等位变异信息进行亲本选拔、组合选配及后代等位条带辅助选择以提高育种成效。
Identification of soybean genotypes resistant to Cercospora sojina by field screening and molecular markers
DOI:10.1094/PDIS-93-4-0408
URL
PMID:30764228
[本文引用: 1]
Frogeye leaf spot (FLS) of soybean, caused by Cercospora sojina, has been a problem in the southern United States for many years and has recently become a greater problem in the northern United States. Cultivars resistant to FLS have been developed for planting in the southern United States and resistance in many of these cultivars is conditioned by the Rcs3 gene. This gene conditions immunity to all known races and isolates of the pathogen. Resistance to C. sojina in soybean genotypes (cultivars and breeding lines) adapted to north-central U.S. production region is unknown. The objectives of this study were to (i) identify maturity group (MG) III, IV, and V soybean genotypes resistant to C. sojina race 11 by field screening at multiple locations over years and (ii) determine whether FLS resistance in these genotypes is likely to be conditioned by the Rcs3 gene. In total, 1,350 genotypes were evaluated for resistance to race 11 in field trials, and 13 MG III, 45 MG IV, and 15 MG V genotypes did not develop symptoms of FLS. Of these, 54 were subsequently tested for the possible presence of Rcs3 using five molecular markers located within 2 centimorgans (cM) of the gene. None of the MG III genotypes tested had the Rcs3 haplotype of cv. Davis, the source of Rcs3; six of the MG IV genotypes and seven of the MG V genotypes had the Rcs3 haplotype. This is the first report of the presence of the Rcs3 haplotype in LN 97-15076 and S99-2281. The soybean genotypes predicted to have the Rcs3 gene and other genotypes with no FLS symptoms in field trials may be useful in developing soybean cultivars with broad resistance to FLS and adapted to the northern United States.
