


大豆作为我国重要的粮食、油料以及饲料兼用作物,近年来的生产总量无法满足日益攀升的消费需求。目前我国是世界上最大的大豆消费国,也是全球最大的进口国,供需关系失衡,仅靠国内生产难以满足需求,大豆高度依赖进口的局面难以改变[1]。这其中的主要原因是我国大豆单产低,效益比较差,同时耕地面积难以增加,因此提高大豆的单产水平迫在眉睫。杂种优势普遍存在于生物界,在许多动植物上均得以体现,并且被认为是提高作物产量的最有效途径之一[2]。杂种优势在水稻、玉米、高粱、油菜和棉花等农作物的生产上广泛应用并获得巨大成功,世界农业生产得到了极大发展[3⇓-5]。杂交大豆同样具有较强的杂种优势,随着世界上第1个大豆杂交种“杂交豆1号”育成并通过审定[6],大豆杂种优势利用进入新阶段。目前我国在该领域一直处于国际领先水平,截至2021年底,在东北及黄淮海大豆主产区已审定39个大豆杂交品种[1]。虽然目前已有一批大豆杂交种育成并通过审定,但是在杂交种实际选育过程中仍存在大量杂交组合盲目配制的问题,导致杂交种的产出率低,部分杂交组合的杂种优势不强,限制了强优势杂交种的产业化应用。借鉴玉米和水稻等作物的杂交育种经验,只有将来源不明的种质资源划分到正确的杂种优势群,才能更好地利用杂种优势模式,提高育种效率,培育出更多的新品种,将杂种优势最大效应[7]发挥在杂种优势群内,进行亲本遗传改良和创制,在不同杂种优势群间进行杂交组合配制,是强优势杂交种选育的重要理论基础。
简单序列重复(simple sequence repeats,SSR)作为一种多态性高、重复性好且较稳定的分子标记,在杂种优势群划分和遗传多样性分析中被广泛应用。如Senior等[8]利用70个SSR标记对94份美国玉米自交系材料进行杂种优势类群的鉴定分析,证实杂种优势类群的鉴定结果与系谱吻合;聂永心等[9]利用70个SSR分子标记对20个玉米自交系划分了5个杂种优势群,聚类分析结果与系谱基本一致,表明SSR标记可以进行玉米自交系遗传变异分析,并用于杂种优势群的划分;罗小金等[10]利用36个SSR分子标记将58份籼型水稻划分为3个杂种优势类群,并发现类群间组合优势强于类群内组合;张涛等[11]利用44个与水稻产量性状基因紧密连锁的功能基因标记对三系杂交水稻亲本进行遗传多样分析,将杂交水稻亲本划分为保持系群和恢复系群,并且证明了功能基因标记与普通分子标记相比具有更高的DNA多态性检测效率,能够准确、可靠地划分类群;于海至[12]利用49个SSR分子标记对199份油菜强优势杂交种亲本进行聚类分析,最终将大部分亲本划分为2个杂种优势群,分析后发现遗传距离中等偏大的亲本间进行组配,杂种优势较为明显。在大豆中也开展了利用SSR标记进行杂交大豆亲本间遗传多样性的分析。吴倩等[3]利用SSR分子标记遗传距离预测大豆亲本间杂种优势,最终发现SSR分子标记对大豆亲本间杂种优势预测未能达到显著水平;白志元等[13]也利用了SSR标记对32份杂交大豆亲本进行了遗传多样性分析,经聚类分析发现,亲本间可以根据地理来源进行类群划分。但上述研究仅仅是通过多态性标记进行分群聚类,不同群内和群间杂交是否具有杂种优势的研究尚未深入展开。
本研究利用筛选获得的14个在杂交大豆亲本间具有较好多态性的产量性状连锁SSR标记,对2002-2022年在东北春大豆主产区审定的30个杂交种所用的43份亲本材料进行亲缘关系分析和遗传多样性评价,探讨亲本间地理来源及遗传距离对强优势杂交种创制的影响,为今后指导亲本选育方向及提高杂交组合组配效率提供理论依据。
1 材料与方法
1.1 试验地概况与材料
试验材料为吉林省农业科学院杂交大豆团队育成的30个春大豆杂交种的亲本材料,包括来源于中国东北、美国和意大利的不育系配套保持系20份与恢复系23份,共计43份。所有试验材料于2021年5月种植在吉林省长春市范家屯镇杂交大豆核心育种基地(124°83′ E,43°43′ N)。试验地行长3m,行距65cm,株距15cm。对所有试验材料进行编号,每份试验材料种植1行。进行常规田间管理,并在试验田四周设置保护行,在行头插牌做标记。选取43份亲本材料V2期(第2个3小叶时期)的新鲜叶片置于液氮中运输,于-80℃冰箱保存。
1.2 SSR标记筛选
对公开发表文献中与大豆籽粒大小、单株粒重、每荚粒数、单株荚数、百粒重、分枝数和主茎节数等产量性状相关SSR分子标记进行检索,选取66个紧密连锁的SSR标记,其引物序列送北京六合华大基因科技有限公司合成。筛选多态性好、重复性高、带型清晰的分子标记用于对43份亲本材料进行多态性的检测。
1.3 基因组DNA提取及PCR检测
使用Nu Clean Plant Genomic DNA Kit(北京康为世纪生物科技有限公司)提取试验材料叶片基因组DNA,并用1%琼脂糖凝胶电泳以及微量分光光度计(thermo,NanoDrop 2000)对提取的基因组DNA进行浓度和质量检测,检测合格的DNA放置于-20℃冰箱保存。
利用SSR分子标记对亲本DNA进行PCR扩增。PCR反应体系为15μL,包括2×ES Taq Master Mix For Page(北京康为世纪生物科技有限公司)7.5μL、ddH2O 4.5μL、上下游引物各1μL、模板1μL。PCR反应程序为95℃预变性5min;95℃变性30s,退火温度为42℃~60℃,72℃延伸30s,循环33次;72℃延伸5min,最终4℃保存。利用8%聚丙烯酰胺凝胶电泳进行检测,电泳前在PCR产物中加入变性剂3μL[14],95℃变性10min。变性后的样品置于凝胶点样孔恒定电压300V电泳2h,电泳结束后在400mL水中加入Super GelRed荧光染料(苏州宇恒生物科技有限公司)试剂40μL,染色10~20min,通过紫外凝胶成像仪(UVP,GelDoc-It 310)成像,记录条带数据。
1.4 数据处理
根据电泳条带迁移的位置对试验结果进行记录,同一位置条带以同一数字进行记录,缺失条带记为“9”,利用Excel记录试验结果。利用Power Marker v3.25软件,采用算术平均非加权方法(unweighted pair-group method with arithmetic means,UPGMA)对亲本材料进行聚类分析,获得聚类树状图。利用PowerMarker v3.25[15]计算每个标记的多态性信息含量(polymorphism information content,PIC),PIC=1-ΣPi2,Pi表示群体中含有第i个等位变异的比例[16]、等位变异数(allele number,Na)、遗传多样性系数(genetic diversity index,GI)、主效基因频率(major alle frequency,MAF)和遗传距离(genetic distance,GD)。根据SSR标记对43份亲本材料检测到的基因型及利用Power Marker v3.25软件得到的分群结果,利用R语言ggplot 2作主坐标分析(principal co-ordinates analysis,PcoA),最终将各点PcoA结果坐标绘制在二维平面图上,制成散点图。
2 结果与分析
2.1 多态性SSR分子标记筛选
通过对文献检索并合成的66个与产量相关性状紧密连锁的SSR分子标记,首先利用4份不同来源地的亲本进行初筛,最终筛选出14个多态性好、带型清晰、检测结果稳定的SSR标记用于进一步分析,具体分子标记信息见表1。
表1 14个SSR标记信息
| SSR标记 SSR marker | 所在染色体 Chromosome | 引物序列 Primer sequence (5′-3′) | 关联性状 Associated trait | 参考文献 Reference |
|---|---|---|---|---|
| BARCSOYSSR_02_1667 | 2 | F:TCGTGTTAGATTTTTACTGTCACATT | 籽粒大小 | [17] |
| R:AACTGCATACCCTTTGTTTGAA | ||||
| BARCSOYSSR_04_0034 | 4 | F:GCGCCCGGAACTTGTAATAACCTAAT | 籽粒大小 | [17] |
| R:GCGCTCTCTTATGATGTTCATAATAA | ||||
| BARCSOYSSR_06_0778 | 6 | F:GCGCATGGTTTACAGATTACTTTATTTTCTA | 单株粒重 | [18] |
| R:GCGGCAATCATTTAAATTTATAATGATATAT | ||||
| BARCSOYSSR_12_1142 | 12 | F:GCGAACTGTAGTTTACTAAAAATAAGTG | 单株粒重 | [19] |
| R:GCGGACTGAATTAATATTGGTGTTGAATT | ||||
| BARCSOYSSR_13_0272 | 13 | F:GCGAATTTGGATTAATTAAATTTATG | 每荚粒数 | [20] |
| R:GCGCTCGGTCCTCTCAAATAAGGTCTC | ||||
| BARCSOYSSR_13_0340 | 13 | F:GCGTGCCAGGTAGAAAAATATTAG | 每荚粒数 | [20] |
| R:GCGGTTTTTCACTTTTCAAAATTC | ||||
| BARCSOYSSR_07_0109 | 7 | F:GCGTTGATACTTTCCTAAGACAAT | 单株荚数 | [21] |
| R:GGGAGAGAAGGCAATCTAA | ||||
| BARCSOYSSR_11_0482 | 11 | F:CACTGCTTTTTCCCCTCTCT | 单株荚数 | [22] |
| R:AAGATACCCCCAACATTATTTGTAA | ||||
| BARCSOYSSR_11_0342 | 11 | F:GCGCTACCGTGTGGTGGTGTGCTACCT | 分枝数 | [23] |
| R:GCGCAAGTGGCCAGCTCATCTATT | ||||
| BARCSOYSSR_19_1071 | 19 | F:CGCACCCCTCATCCTATGTA | 分枝数 | [24] |
| R:CCAACTAATCCCAGGGACTTACTT | ||||
| BARCSOYSSR_06_1581 | 6 | F:GCGCTGGCCTTTAGAAC | 百粒重 | [25] |
| R:GCGTTGTAGGAAATTTGAGTAGTAAG | ||||
| BARCSOYSSR_13_1098 | 13 | F:GCGTTAAGAATGCATTTATGTTTAGTC | 百粒重 | [26] |
| R:GCGAGTTTTTGGTTGGATTGAGTTG | ||||
| BARCSOYSSR_01_1571 | 1 | F:GCGCATGATAACCTATAATGAGAT | 主茎节数 | [27] |
| R:CCAGCAAGCAATGCTCGGTCTACT | ||||
| BARCSOYSSR_13_1271 | 13 | F:CAAGCTCAAGCCTCACACAT | 主茎节数 | [28] |
| R:TGACCAGAGTCCAAAGTTCATC |
2.2 基于SSR多态性数据的聚类分析
图1
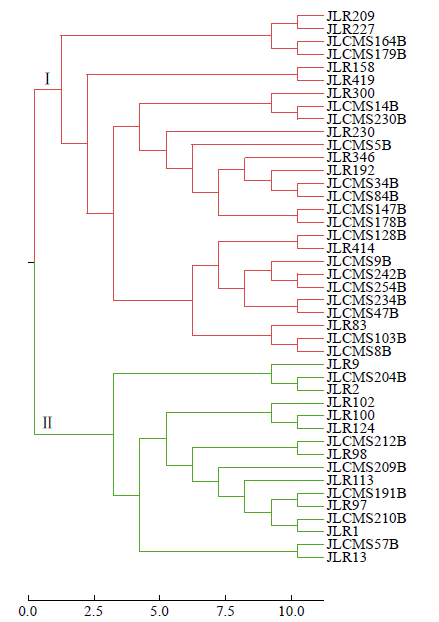
图1
SSR标记对亲本材料的UPGMA聚类分析
Fig.1
UPGMA cluster of parent materials based on SSR markers
表2 杂交种亲本分群结果
Table 2
| 杂交种名称 Hybrid name | 母本Female parent | 父本Male parent | 亲本间遗传距离 GD between parents | ||||||||||
|---|---|---|---|---|---|---|---|---|---|---|---|---|---|
| 同型保持系 Homotypic maintainers | 来源地 Place of origin | 所在群 Group | 名称 Name | 来源地 Place of origin | 所在群 Group | ||||||||
| 杂交豆1号 | JLCMS9B | 中国黑龙江 | Ⅰ | JLR1 | 美国 | Ⅱ | 0.6153 | ||||||
| 杂交豆2号 | JLCMS47B | 中国吉林 | Ⅰ | JLR2 | 美国 | Ⅱ | 0.6428 | ||||||
| 杂交豆3号 | JLCMS8B | 中国黑龙江 | Ⅰ | JLR9 | 美国 | Ⅱ | 0.5000 | ||||||
| 杂交豆4号 | JLCMS47B | 中国吉林 | Ⅰ | JLR83 | 意大利 | Ⅰ | 0.5384 | ||||||
| 杂交豆5号 | JLCMS84B | 中国黑龙江 | Ⅰ | JLR1 | 美国 | Ⅱ | 0.4285 | ||||||
| 吉育606 | JLCMS47B | 中国吉林 | Ⅰ | JLR100 | 美国 | Ⅱ | 0.5000 | ||||||
| 吉育607 | JLCMS14B | 中国黑龙江 | Ⅰ | JLR83 | 意大利 | Ⅰ | 0.2307 | ||||||
| 吉育608 | JLCMS84B | 中国黑龙江 | Ⅰ | JLR113 | 美国 | Ⅱ | 0.5000 | ||||||
| 吉育609 | JLCMS103B | 中国黑龙江 | Ⅰ | JLR102 | 美国 | Ⅱ | 0.2076 | ||||||
| 吉育610 | JLCMS128B | 中国吉林 | Ⅰ | JLR98 | 美国 | Ⅱ | 0.5714 | ||||||
| 吉育611 | JLCMS147B | 中国黑龙江 | Ⅰ | JLR113 | 美国 | Ⅱ | 0.3571 | ||||||
| 吉育612 | JLCMS57B | 美国 | Ⅱ | JLR9 | 美国 | Ⅱ | 0.3846 | ||||||
| 吉育626 | JLCMS230B | 中国吉林 | Ⅰ | JLR9 | 美国 | Ⅱ | 0.3571 | ||||||
| 吉育627 | JLCMS179B | 美国 | Ⅰ | JLR9 | 美国 | Ⅱ | 0.5000 | ||||||
| 吉育633 | JLCMS204B | 美国 | Ⅱ | JLR230 | 中国吉林 | Ⅰ | 0.4285 | ||||||
| 吉育635 | JLCMS34B | 中国黑龙江 | Ⅰ | JLR300 | 中国黑龙江 | Ⅰ | 0.4285 | ||||||
| 吉育637 | JLCMS210B | 美国 | Ⅱ | JLR209 | 中国吉林 | Ⅰ | 0.5714 | ||||||
| 吉育639 | JLCMS178B | 中国吉林 | Ⅰ | JLR97 | 美国 | Ⅱ | 0.4285 | ||||||
| 吉育641 | JLCMS191B | 美国 | Ⅱ | JLR158 | 中国黑龙江 | Ⅰ | 0.5000 | ||||||
| 杂交种名称 Hybrid name | 母本Female parent | 父本Male parent | 亲本间遗传距离 GD between parents | ||||||||||
| 同型保持系 Homotypic maintainers | 来源地 Place of origin | 所在群 Group | 名称 Name | 来源地 Place of origin | 所在群 Group | ||||||||
| 吉育643 | JLCMS212B | 美国 | Ⅱ | JLR346 | 中国吉林 | Ⅰ | 0.6666 | ||||||
| 吉育645 | JLCMS234B | 中国黑龙江 | Ⅰ | JLR9 | 美国 | Ⅱ | 0.5000 | ||||||
| 吉育647 | JLCMS5B | 中国黑龙江 | Ⅰ | JLR2 | 美国 | Ⅱ | 0.4285 | ||||||
| 吉育649 | JLCMS209B | 美国 | Ⅱ | JLR158 | 中国黑龙江 | Ⅰ | 0.6428 | ||||||
| 吉育653 | JLCMS242B | 中国吉林 | Ⅰ | JLR300 | 中国黑龙江 | Ⅰ | 0.3571 | ||||||
| 吉育654 | JLCMS234B | 中国黑龙江 | Ⅰ | JLR13 | 美国 | Ⅱ | 0.2857 | ||||||
| 吉育660 | JLCMS204B | 美国 | Ⅱ | JLR419 | 中国吉林 | Ⅰ | 0.4285 | ||||||
| 吉育667 | JLCMS164B | 美国 | Ⅰ | JLR227 | 中国吉林 | Ⅰ | 0.3076 | ||||||
| 佳吉1号 | JLCMS178B | 中国吉林 | Ⅰ | JLR124 | 美国 | Ⅱ | 0.5714 | ||||||
| 吉农H1 | JLCMS254B | 美国 | Ⅰ | JLR192 | 中国黑龙江 | Ⅰ | 0.5000 | ||||||
| 吉农H2 | JLCMS212B | 美国 | Ⅱ | JLR414 | 中国吉林 | Ⅰ | 0.5714 | ||||||
另外,根据表2中所列亲本间的地理来源信息,26个杂交种属于国内与国外亲本杂交获得,仅有2个为美国亲本间杂交获得,2个为国内亲本间杂交获得。杂交种亲本来源既满足不同类群又符合不同地理来源的杂交种个数为23个,说明分子标记划分的杂种优势类群结果与地理来源分布基本一致。分子标记划分的杂种优势类群结果与地理来源分布不一致的情况主要表现为,杂交种亲本均来自美国,但分子标记分析结果可以划分为类群Ⅱ(吉育612),分别属于美国和中国的吉农H1和吉育667以及均属于中国的吉育635和吉育653被划分到了类群Ⅰ。
进一步对杂交种亲本间GD的分布情况(图2)进行分析发现,43份亲本间的GD均值为0.3845,30个杂交种成对亲本间的GD均值为0.4650,亲本间GD在0.5~0.6的组合频率最高,共有12个,占所有组合的40.00%。亲本间GD在0.4~0.5的组合有6个,占总数的20.00%,亲本间GD在0.3~0.4的组合有5个,占总数的16.67%。推测GD在0.4~0.6时杂种优势利用效率较高。考虑到大豆杂种优势利用时,为减少组配的盲目性,优先组配亲本GD在0.5~0.6的杂交组合。
图2
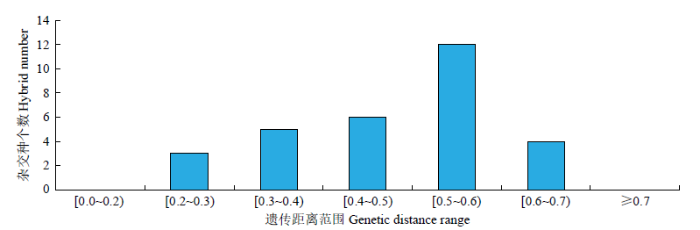
图2
SSR标记分析杂交种亲本遗传距离分布
Fig.2
Genetic distance distribution of hybrid parents based on SSR markers
2.3 遗传多样性分析
进一步对43份亲本材料进行遗传多样性分析(表3和图3)发现,总群的MAF均值为0.6871,范围在0.4419~0.9302;类群Ⅰ均值为0.7233,范围在0.4074~1.0000;类群Ⅱ的均值为0.7622,范围在0.5000~1.0000。总群的Na均值为2.2143,范围在2.0000~4.0000;类群Ⅰ的均值为2.0714,范围在1.0000~4.0000;类群Ⅱ的均值为1.9286,范围在1.0000~2.0000。总群的GI均值为0.4043,范围在0.1298~0.6101;类群Ⅰ的均值为0.3449,范围在0.0000~0.6475;类群Ⅱ均值为0.3243,范围在0.0000~0.5000。总群的PIC均值为0.3280,范围在0.1214~0.5272;在类群Ⅰ中,PIC均值为0.2801,范围在0.0000~0.5720;在类群Ⅱ中,PIC均值为0.2612,范围在0.0000~0.3750。总群GD范围在0.0000~0.6923,类群Ⅰ的范围在0.0000~0.6153,类群Ⅱ的范围在0.0000~0.4285。上述结果表明,类群Ⅰ的遗传多样性水平高于类群Ⅱ。
表3 SSR标记对不同群试验材料的遗传多样性分析
Table 3
| 来源Origin | MAF | Na | GI | PIC | |
|---|---|---|---|---|---|
| 总群Total group | 均值 | 0.6871 | 2.2143 | 0.4043 | 0.3280 |
| 范围 | (0.4419~0.9302) | (2.0000~4.0000) | (0.1298~0.6101) | (0.1214~0.5272) | |
| 类群Ⅰ GroupⅠ | 均值 | 0.7233 | 2.0714 | 0.3449 | 0.2801 |
| 范围 | (0.4074~1.0000) | (1.0000~4.0000) | (0.0000~0.6475) | (0.0000~0.5720) | |
| 类群Ⅱ GroupⅡ | 均值 | 0.7622 | 1.9286 | 0.3243 | 0.2612 |
| 范围 | (0.5000~1.0000) | (1.0000~2.0000) | (0.0000~0.5000) | (0.0000~0.3750) |
图3
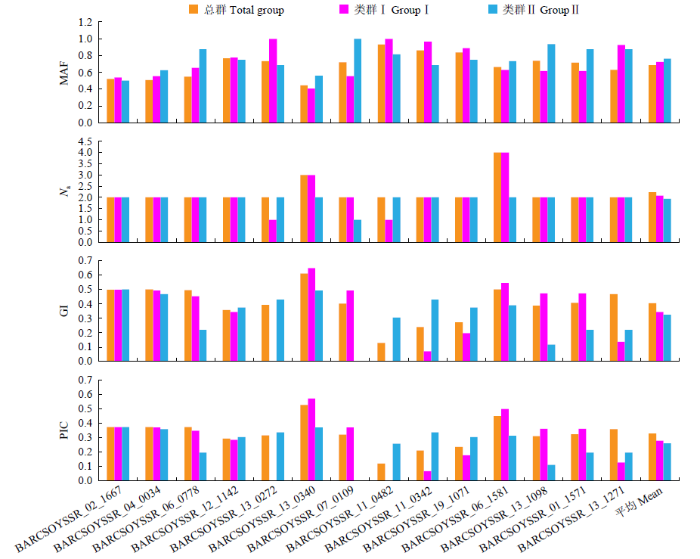
图3
SSR标记对群体间的遗传多样性分析
Fig.3
Analysis of genetic diversity between groups by SSR markers
从图4中可知,利用PC1和PC2主成分将43份亲本清晰地划分为2个集合,集合Ⅰ包含23份材料,70%以上为中国东北材料;集合Ⅱ包含20份材料,全部为美国材料;有8份材料在2集合交汇位置聚集,这部分材料中存在混合血缘材料。这与SSR标记聚类图的分析结果较为一致,证明中国东北与国外材料之间配制的杂交组合存在较强的杂种优势。材料间遗传距离分布范围较广,散点密集度较小,进一步表明中国东北春大豆区审定的杂交种的亲本材料分化程度较高,遗传差异较大,种质资源背景较为丰富。
图4
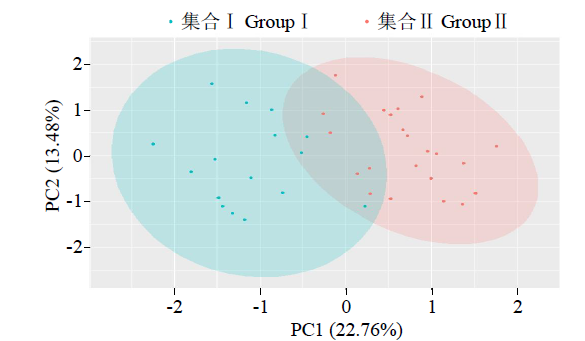
图4
基于SSR标记检测基因型及分群结果的PcoA散点图
Fig.4
PcoA scatter plot based on SSR marker detection of genotype and clustering results
3 讨论
本研究利用SSR分子标记根据遗传距离对30个审定大豆杂交种的43份亲本材料进行聚类分群,划分结果与亲本地理来源结果基本一致,相同地理来源的试验材料基本可以聚在一个大群中,这与钟文娟等[29]和魏苗等[30]的研究结果相同,表明SSR标记聚类结果与地理来源之间存在一致性。个别不同来源材料会聚类到一个类群,可能是由于跨地区引种导致的遗传背景聚合所致,类似的结果在糜子聚类分群研究中也同样出现[31];强海平等[32]利用SSR标记对中国和美国来源的紫花苜蓿进行聚类分析时也发现,由于每个品种存在多个亲本参与杂交的过程,导致部分品种间存在一定的亲缘关系,聚类时个别材料出现偏差。也可能是因为本研究所用SSR标记数量未能覆盖大豆全部20条染色体,对个别亲缘关系较为复杂的亲本无法进行精准判断所致。
从分群结果来看,30个审定春大豆杂交种中有26个为中国东北与国外材料杂交组配育成,且上述杂交种亲本大多分属于不同遗传类群,也印证了遗传背景差异越大,杂种优势越强的理论[33]。另外,也不乏国内或美国材料内部的组配育成了强优势杂交种,这表明同一来源且属于同一类群间的亲本同样会育成强优势杂交种,但概率会较低。根据43份亲本聚类分群结果来看,80%的杂交种的亲本分属于不同类群,大部分杂交种均由中国和国外材料进行组配获得。但个别材料如来源于美国的JLCMS164B和JLCMS254B被聚在中国东北材料群中,推测其可能由中国引进尚未被改良或尚存大部分中国材料遗传背景,所以通过SSR标记分析将其与中国材料聚入同一类群。
Lippman等[34]认为育种者应该努力增加亲本种群之间的遗传距离,以最大化杂种优势。但Moll等[35]却提出,亲本不应超过最佳GD,以避免由于有害的上位效应而降低杂种优势。然而Boeven等[36]最近的研究证实,杂种优势随亲本间GD的增加而稳定增加,父母本群体之间可以尽可能保持距离,后代优势不会因此而下降。本研究计算了43份春大豆杂交种亲本间的GD,发现所用杂交种亲本的GD在0.4~0.6时,杂种优势利用程度较高,这与Moll等[35]的结论较为一致,然而本研究中仍有部分杂交种亲本的GD在0.6~0.7。因此,杂种优势是否存在最佳GD或者会随亲本间GD的增加而增加,仍有待于进一步开展研究。
4 结论
利用14个大豆产量性状连锁SSR分子标记对2002-2022年中国东北春大豆产区审定的30个杂交种的43份亲本材料进行杂种优势群划分和验证,通过UPGMA法将43份亲本材料划分为2个类群,不同地理来源种质资源亲缘关系较近,聚类结果与地理来源基本一致。已审定强优势杂交种的亲本80%以上分属上述2个类群,且为中国东北与国外材料杂交获得,表明GD较远且存在地理远源的杂交大豆亲本材料之间进行杂交组配,会产生较强的杂种优势。
参考文献
Utility of SSRs for determining genetic similarities and relationships in maize using an agarose gel system
DOI:10.2135/cropsci1998.0011183X003800040034x URL [本文引用: 1]
Power Marker:an integrated analysis environment for genetic marker analysis
DOI:10.1093/bioinformatics/bti282 URL [本文引用: 1]
Association mapping for seed size and shape traits in soybean cultivars
DOI:10.1007/s11032-012-9833-5 URL [本文引用: 2]
Analysis of quantitative trait loci for main plant traits in soybean
DOI:10.4238/2015.June.8.8
PMID:26125811
[本文引用: 1]

Plant traits are important indices for regulating and controlling yield ability in soybean varieties. It is important to comprehensively study the quantitative trait locus (QTL) mapping for soybean plant traits, cloning related genes, and marker assistant breeding. In this study, 236 F2 generation plants and a derivative group were constructed by using Jiyu50 and Jinong18, obtained from Jilin Province. A total of 102 simple sequence repeat markers were used to construct a genetic linkage map. With 2 years of molecular and phenotypic data, QTL analyses and mapping were conducted for soybean maturity, plant height, main stem node, main stem branch, seed weight per plant, and more. Five main plant traits were analyzed via inclusive composite interval mapping using QTL IciMapping v2.2. Using one-dimensional scanning, a total of 30 QTLs were detected and distributed across 1 (A1), 4 (C2), and 12 (G). There were 9 linkage groups, including 16 major QTLs. Using two-dimensional scanning, 7 pairs of epistatic QTL interactions for maturity and plant height were detected in the soybean.
QTL analysis of soybean seed weight across multi-genetic backgrounds and environments
DOI:10.1007/s00122-012-1859-x URL [本文引用: 1]
Global gene expression profiles in developing soybean seeds
DOI:10.1016/j.plaphy.2011.12.007 URL [本文引用: 2]
QTL identification of yield-related traits and their association with flowering and maturity in soybean
DOI:10.1007/s12892-010-0115-7 URL [本文引用: 1]
Identification of genomic regions determining flower and pod numbers development in soybean (Glycine max L.)
DOI:10.1016/S1673-8527(09)60074-6
PMID:20816387
[本文引用: 1]
Flower and pod numbers per plant are important agronomic traits underlying soybean yield. So far quantitative trait loci (QTL) detected for flower and pod-related traits have mainly focused on the final stage, and might therefore have ignored genetic effects expressed during a specific developmental stage. Here, dynamic expressions of QTL for flower and pod numbers were identified using 152 recombinant inbred lines (RILs) and a linkage map of 306 markers. Wide genetic variation was found among RILs; 17 unconditional and 18 conditional QTL were detected for the two traits at different developmental stages over two years. Some QTL were detected only at one stage and others across two or more stages, indicating that soybean flower and pod numbers development may be governed by time-dependent gene expression. Three main QTL (qfn-Chr18-2, qfn-Chr20-1, and qfn-Chr19) were detected for flower number, and two main QTL (qpn-Chr11 and qpn-Chr20) were detected for pod number. The phenotypic variation explained by them ranged from 6.1% to 34.7%. The markers linked to these QTL could be used in marker-assisted selection for increasing soybean flower and pod numbers, with the ultimate aim of increasing soybean yield. Comparison of the QTL regions for flower and pod numbers traits with the related genes reported previously showed that seven and four related genes were located in the QTL regions of qfn-Chr11 and qfn-Chr19, respectively. These results provide a basis for fine mapping and cloning of flower and pod development-related genes.
QTL mapping of ten agronomic traits on the soybean (Glycine max L. Merr.) Genetic map and their association with EST markers
A set of 184 recombinant inbred lines (RILs) derived from soybean vars. Kefeng No.1 x Nannong 1138-2 was used to construct a genetic linkage map. The two parents exhibit contrasting characteristics for most of the traits that were mapped. Using restricted fragment length polymorphisms (RFLPs), simple sequence repeats (SSRs) and expressed sequence tags (ESTs), we mapped 452 markers onto 21 linkage groups and covered 3595.9 cM of the soybean genome. All of the linkage groups except linkage group F were consistent with those of the consensus map of Cregan et al. (1999). Linkage group F was divided into two linkage groups, F1 and F2. The map consisted of 189 RFLPs, 219 SSRs, 40 ESTs, three R gene loci and one phenotype marker. Ten agronomic traits-days to flowering, days to maturity, plant height, number of nodes on main stem, lodging, number of pods per node, protein content, oil content, 100-seed weight, and plot yield-were studied. Using winqtlcart, we detected 63 quantitative trait loci (QTLs) that had LOD>3 for nine of the agronomic traits (only exception being seed oil content) and mapped these on 12 linkage groups. Most of the QTLs were clustered, especially on groups B1 and C2. Some QTLs were mapped to the same loci. This pleiotropism was common for most of the QTLs, and one QTL could influence at most five traits. Seven EST markers were found to be linked closely with or located at the same loci as the QTLs. EST marker GmKF059a, encoding a repressor protein and mapped on group C2, accounted for about 20% of the total variation of days to flowering, plant height, lodging and nodes on the main stem, respectively.
Seed quality QTL in a prominent soybean population
Soybean [Glycine max (L.) Merr.] is a versatile crop due to its multitude of uses as a high protein meal and vegetable oil. Soybean seed traits such as seed protein and oil concentration and seed size are important quantitative traits. The objective of this study was to identify representative protein, oil, and seed size quantitative trait loci (QTL) in soybean. A recombinant inbred line (RIL) population consisting of 131 F6-derived lines was created from two prominent ancestors of North American soybeans ('Essex' and 'Williams') and the RILs were grown in six environments. One hundred simple sequence repeat (SSR) markers spaced throughout the genome were mapped in this population. There were a total of four protein, six oil, and seven seed size QTL found in this population. The QTL found in this study may assist breeders in marker-assisted selection (MAS) to retain current positive QTL in modern soybeans while simultaneously pyramiding additional QTL from new germplasm.Copyright 2004 Springer-Verlag
Mapping and comparison of quantitative trait loci for soybean branching phenotype in two locations
DOI:10.1270/jsbbs.60.380 URL [本文引用: 1]
QTL analysis of major agronomic traits in soybean
QTL mapping for the number of branches and pods using wild chromosome segment substitution lines in soybean [Glycine max (L.) Merr.]
A comparative study on segregation analysis and QTL mapping of quantitative traits in plants with a case in soybean
DOI:10.1007/s11703-007-0001-3 URL [本文引用: 1]
Optimizing parental selection for genetic linkage maps
Genetic linkage maps based on restriction fragment length polymorphisms are useful for many purposes; however, different populations are required to fulfill different objectives. Clones from the linkage map(s) are subsequently probed onto populations developed for special purposes such as gene tagging. Therefore, clones contained on the initial map(s) must be polymorphic on a wide range of genotypes to have maximum utility. The objectives of this research were to (i) calculate polymorphism information content values of 51 low-copy DNA clones and (ii) use the resulting values to choose potential mapping parents. Polymorphism information content was calculated using gene diversity by classifying restriction fragment patterns on a diverse set of 18 wheat genotypes. Combinations of potential parents were then compared by examining both the proportion of polymorphic clones and the likelihood that those mapped clones would give a polymorphism when used on other populations. Genotype pairs were identified that would map more highly informative DNA clones compared with a population derived from the most polymorphic potential parents. The methodologies used to characterize clones and rank potential parents should be applicable to other species and types of markers as well.
Heterosis:revisiting the magic
DOI:10.1016/j.tig.2006.12.006 URL [本文引用: 1]
The relation of heterosis and genetic divergence in maize
DOI:10.1093/genetics/52.1.139 PMID:17248265 [本文引用: 2]
Negative dominance and dominance-by-dominance epistatic effects reduce grain-yield heterosis in wide crosses in wheat
