


种植密度是影响玉米籽粒产量的重要因素之一,合理增加群体密度是获得高产的关键措施[1]。从2005年开始,中国玉米主推郑单958和先玉335等耐密性品种,种植密度显著增加,玉米单产随之增加[2]。目前,黄淮海平原夏玉米种植密度一般为6.0×10⁴~9.0×10⁴株/hm2[3],玉米单位面积产量一般随密度增加呈单峰曲线变化,在最适密度下获得最高产量,当超过最适宜密度后,会引起群体光合特性、叶面积指数和干物质积累量降低,直接影响植株的光合作用及干物质的积累与分配,从而降低光能利用率、限制籽粒库的建成[4⇓⇓-7]。因此,选择适宜密度、构建合理的群体结构、协调和解决单株和群体生产力的矛盾是提高玉米单产的重要途径。
1 材料与方法
1.1 试验地概况
试验设置在河南省鹤壁市淇滨区钜桥镇鹤壁市农业科学院科研基地(114°33′06″ E,35°40′34″ N),土壤为潮土,玉米播种前按“S”形五点取样法取0~30cm的土壤基础样品,充分混合后测定其基本化学性质,其中全氮1.17g/kg、碱解氮66.34mg/kg、速效磷15.9mg/kg、速效钾271.68mg/kg、有机质19.5g/kg、pH 8.21。
1.2 试验设计
试验采用裂区设计,主因素为种植密度,分别为6.00×10⁴、6.75×10⁴、7.50×10⁴、8.25×10⁴、9.00×10⁴、9.75×10⁴和10.50×10⁴株/hm2,分别编号为D1、D2、D3、D4、D5、D6和D7;副因素为玉米品种,分别为郑单309(ZD309)、郑单326(ZD326)、郑单958(ZD958)和中玉303(ZY303)。共28个处理,每个处理3次重复,8行区,行长5.0m,行距0.6m。试验时间为2020年6月15日-10月5日。玉米生育期内的田间管理措施与当地大田生产管理保持一致。
1.3 测定项目与方法
1.3.1 干物质量
在夏玉米苗期、拔节期、大喇叭口期、吐丝期、吐丝后20d和成熟期选取连续5株长势一致的代表性植株,测定鲜重,烘干后称干重。
1.3.2 株高和穗位高
在吐丝后20d,选取连续5株长势一致的代表性植株,测量从地面至雄穗顶端(株高)和最上部果穗着生节位(穗位高)的高度。
1.3.3 产量
取小区中间2行玉米全部收获,随机选取15穗进行考种,晒干脱粒,测定籽粒含水量和籽粒质量,并折合含水率14%计算产量。
1.4 数据处理
收获指数=籽粒干重/植株干物质重。采用Excel 2010和SPSS 22进行数据统计与分析,用LSD法和Duncan法进行方差分析和多重比较(P<0.05)。
2 结果与分析
2.1 不同密度和品种对夏玉米株高和穗位高的影响
不同密度和品种对夏玉米株高和穗位高的影响不同。从图1可以看出,各处理间以D2ZY303株高最高,为288.7cm,分别较D2ZD326、D4ZD326、D1ZD309、D5ZD326和D5ZD958高出12.1%、11.9%、11.8%、9.3%和8.8%,以D6ZD326最低,仅为249.9cm。品种间表现为ZY303>ZD958、ZD309>ZD326。
图1

图1
不同密度和品种对夏玉米株高的影响
不同小写字母表示0.05水平下差异显著,下同
Fig.1
Effects of density and varieties on the plant height of summer maize
Different lowercase letters indicate significant difference at 0.05 level, the same below
图2显示,各处理间穗位高以D7ZD958最高,为143.2cm,D3ZD958、D1ZD958、D6ZD958和D5ZD958与之无显著差异,其次是D1ZY303、D4ZD958、D5ZY303、D3ZY303、D6ZY303、D2ZY303和D4ZY303,以D4ZD326最低,为93.7cm。7个密度间表现为D7和D3处理下穗位高较高,平均分别为126.1和122.7cm,各品种以ZD958最高,平均为136.0cm,以ZD326最低,平均为103.3cm。
图2
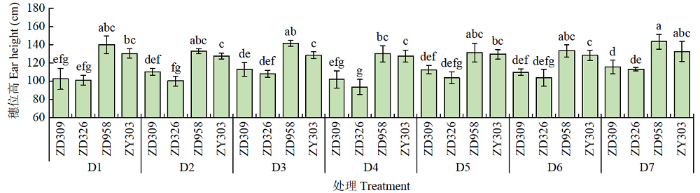
图2
不同密度和品种对夏玉米穗位高的影响
Fig.2
Effects of density and varieties on the ear height of summer maize
2.2 不同密度和品种对夏玉米生育期干物质累积量的影响
如图3所示,随生育期推进,植株干物质累积量不断增加。ZD309在吐丝期前以D6处理下干物质累积量最高,从吐丝期至成熟期,D7表现出明显的优势,ZD326在整个生育期以D4、D5和D6处理下的干物质累积量表现较高,而ZD958和ZY303在各个时期内大致表现为随种植密度的增加,干物质累积量呈明显增加趋势。综合来看,在苗期,各密度处理下以D4处理干物质累积量最高,拔节期则以D6处理最高,大喇叭口期至成熟期,D7处理下表现出明显的优势,而整个生育期内D1和D2处理下的干物质累积量最低。苗期、拔节期和大喇叭口期各品种间的平均干物质累积量差异不明显,吐丝期ZY303干物质累积量为9.80t/hm2,明显高于ZD958,灌浆期ZD958和ZY303之间无明显差异,但均明显高于ZD326。
图3
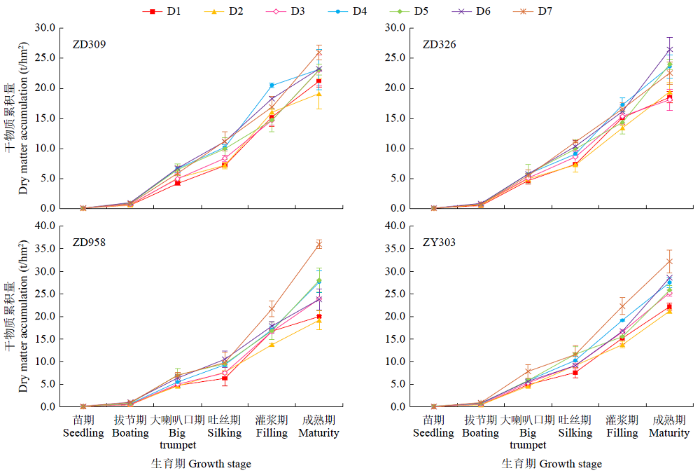
图3
不同密度和品种对夏玉米干物质累积量的影响
Fig.3
Effects of density and varieties on the dry matter accumulation of summer maize
2.3 不同密度和品种对夏玉米花前和花后干物质生产的影响
由表1可见,密度对成熟期干物质量、花前和花后的干物质量的影响均达显著水平,品种对成熟期干物质量、花前和花后干物质量及花后占成熟期干物质量比重有显著影响,二者的交互作用对成熟期干物质量、花后干物质量和花后干物质量占成熟期比重的影响均达显著水平。成熟期干物质量平均为24.02t/hm2,花前干物质量为9.22t/hm2,花后干物质量为14.80t/hm2,花后干物质量占比61.0%。成熟期干物质量各密度处理表现为D7处理最高,其次是D6、D4和D5处理,以D1和D2处理最低,品种间表现为ZY303>ZD958>ZD326、ZD309,花前和花后干物质量在不同处理下的表现趋势同成熟期干物质量。
表1 不同因素对夏玉米花前花后干物质生产的影响
Table 1
| 因素 Factor | 干物质量Dry matter (t/hm2) | 花后干物质量/成熟期干物质量 Dry matter after anthesis/dry matter in maturity (%) | ||
|---|---|---|---|---|
| 成熟期Maturity | 花前Before anthesis | 花后After anthesis | ||
| 密度Densitiy | ||||
| D1 | 20.46±1.58d | 7.10±1.00d | 13.36±1.69cd | 65.15±5.29a |
| D2 | 19.73±2.04d | 7.81±1.03cd | 11.92±1.86d | 60.23±5.12ab |
| D3 | 22.56±3.79c | 8.41±1.17c | 14.15±3.63bcd | 61.65±8.71ab |
| D4 | 25.46±2.99b | 9.71±0.73b | 15.75±3.11b | 61.33±5.88ab |
| D5 | 25.23±3.21b | 10.28±1.50ab | 14.95±3.57bc | 58.75±7.40b |
| D6 | 25.52±3.55b | 10.29±0.99ab | 15.23±4.11bc | 58.61±9.17b |
| D7 | 29.16±5.78a | 10.92±1.61a | 18.24±6.32a | 60.92±10.15ab |
| 品种Variety | ||||
| ZD309 | 22.66±3.04b | 9.31±1.83ab | 13.35±2.77b | 58.64±7.99bc |
| ZD326 | 21.79±3.58b | 9.11±1.59ab | 12.68±2.92b | 57.72±6.83c |
| ZD958 | 25.50±5.93a | 8.65±1.83b | 16.86±5.29a | 65.23±7.81a |
| ZD303 | 26.11±3.92a | 9.81±1.71a | 16.31±3.26a | 62.20±5.67b |
| F检验F test | ||||
| 密度Density | ** | ** | ** | ns |
| 品种Variety | ** | * | ** | ** |
| 密度×品种Density×variety | ** | ns | ** | ** |
“*”表示在P < 0.05水平下差异显著,“**”表示在P < 0.01水平下差异显著,ns表示在P < 0.05水平下差异不显著
“*”represents significant difference at 0.05 level,“**”represents significant difference at 0.01 level, ns represents no significant difference at 0.05 level
花后干物质量/成熟期干物质量在各密度处理下表现为D1处理下最高,为65.15%,其次是D3和D4处理,以D6和D5处理最低;品种间表现为ZD958最高,为65.23%,其次是ZY303(62.20%),ZD326最低。
表2显示,各处理下成熟期干物质量以D7ZD958处理下最高,为35.96t/hm2,D7ZY303处理与之差异不明显,其次是D6ZY303和D5ZD958处理,以D3ZD326和D1ZD326处理最低,分别为18.09和18.49t/hm2。花前干物质量以D5ZY303处理最高,为11.70t/hm2;D1ZD958处理最低,仅为6.28t/hm2;花后干物质量在D7ZD958处理下达最高,为26.14t/hm2,其次是D7ZY303处理,D3ZD326处理最低;花后干物质量占成熟期比重在D7ZD958处理下最高,为72.64%,D7ZD326和D6ZD309处理最低,分别为50.46%和50.53%。
表2 不同密度和品种处理对夏玉米花前、花后干物质生产的影响
Table 2
| 密度 Density | 品种 Variety | 干物质量Dry matter (t/hm2) | 花后干物质量/成熟期干物质量 Dry matter after anthesis/dry matter in maturity (%) | ||
|---|---|---|---|---|---|
| 成熟期Maturity | 花前Before anthesis | 花后After anthesis | |||
| D1 | ZD309 | 21.18±0.97ghij | 7.17±0.18fg | 14.01±0.98defg | 66.11±1.77abc |
| ZD326 | 18.49±0.97ij | 7.37±0.18efg | 11.12±1.11fg | 60.02±2.98bcde | |
| ZD958 | 20.01±0.16hij | 6.28±1.59g | 13.74±1.47defg | 68.68±7.76ab | |
| ZY303 | 22.16±0.77fghij | 7.59±1.20efg | 14.57±0.86cdefg | 65.79±4.68abc | |
| D2 | ZD309 | 19.10±2.53hij | 7.18±0.52fg | 11.92±2.54fg | 62.02±5.40abcde |
| ZD326 | 19.40±1.49hij | 7.28±1.25fg | 12.12±0.96efg | 62.55±4.72abcd | |
| ZD958 | 19.20±3.10hij | 7.65±0.32efg | 11.55±3.38fg | 59.35±7.78bcde | |
| ZY303 | 21.21±0.46ghij | 9.13±0.46cdef | 12.08±0.24efg | 56.97±1.46bcde | |
| D3 | ZD309 | 23.01±2.56efghi | 8.37±0.54defg | 14.64±3.09cdefg | 63.18±6.17abc |
| ZD326 | 18.09±4.75j | 8.60±1.06def | 9.49±3.91g | 50.89±9.18de | |
| ZD958 | 23.90±2.38cdefgh | 7.50±1.79efg | 16.40±1.14bcdef | 68.86±5.23ab | |
| ZY303 | 25.24±0.70cdefg | 9.18±0.82cdef | 16.06±0.58bcdef | 63.64±2.58abc | |
| D4 | ZD309 | 23.10±3.33efghi | 10.19±0.40abcd | 12.90±3.67efg | 55.12±7.82cde |
| ZD326 | 23.59±1.91defgh | 9.08±0.39cdef | 14.50±1.91cdefg | 61.32±3.48abcde | |
| ZD958 | 27.64±2.42cde | 9.27±0.49cdef | 18.37±2.75bcd | 66.24±4.24abc | |
| ZY303 | 27.52±1.18cde | 10.28±0.80abcd | 17.24±0.53bcde | 62.66±1.55abcd | |
| D5 | ZD309 | 23.05±0.92efghi | 9.95±1.83abcd | 13.10±2.04efg | 56.78±8.30bcde |
| ZD326 | 23.99±0.84cdefgh | 9.97±1.44abcd | 14.02±2.18defg | 58.30±7.28bcde | |
| ZD958 | 28.01±5.69bcd | 9.51±0.45bcde | 18.50±5.42bcd | 65.31±5.63abc | |
| ZY303 | 25.87±1.01cdefg | 11.70±1.58a | 14.16±2.34defg | 54.62±7.16cde | |
| D6 | ZD309 | 23.23±5.05defghi | 11.12±0.35abc | 12.11±4.81efg | 50.53±11.03e |
| ZD326 | 26.42±2.01cdef | 10.35±0.99abcd | 16.07±2.98bcdef | 60.50±6.43bcde | |
| ZD958 | 23.81±1.76cdefgh | 10.51±0.99abcd | 13.31±2.63defg | 55.55±7.18cde | |
| ZY303 | 28.60±2.96bc | 9.17±0.51cdef | 19.44±2.47bc | 67.84±1.77ab | |
| D7 | ZD309 | 25.96±1.18cdefg | 11.18±1.55abc | 14.77±2.64cdef | 56.71±7.55bcde |
| ZD326 | 22.52±1.88fghij | 11.10±0.13abc | 11.42±1.98fg | 50.46±4.57e | |
| ZD958 | 35.96±0.98a | 9.82±2.31abcd | 26.14±2.82a | 72.64±6.84a | |
| ZY303 | 32.21±3.55ab | 11.60±1.96ab | 20.61±3.32b | 63.86±5.65abc | |
2.4 不同密度和品种对夏玉米籽粒产量及其构成因素的影响
F检验结果(表3)显示,种植密度对行粒数、千粒重、产量和收获指数的影响显著,品种对穗行数、行粒数和产量的影响达显著水平,二者交互作用对夏玉米籽粒产量的影响达显著水平。穗行数在各品种间表现为ZY303最高,为17.6,其他3个品种间无显著差异;7个密度处理下的行粒数表现为D1、D2、D3、D4较高,品种间表现为ZD958>ZY303>ZD309>ZD326;D1处理下的千粒重为388.48g,较D7和D6分别增加10.2%和9.1%,品种间无显著差异。产量结果表明,各密度处理以D7下产量最高,其次是D6处理,D1处理下产量最低,仅为10.32t/hm2,各品种表现为ZY303>ZD958>ZD309>ZD326,ZY303较ZD326和ZD309分别增加18.8%和13.9%。本试验条件下的收获指数平均为0.52。各种植密度以D2处理下最高,为0.55,以D5处理下最低,各品种表现为ZD326最高,为0.53(表3)。
表3 不同处理对夏玉米籽粒产量及其构成因素的影响
Table 3
| 因素 Factor | 穗行数 Rows per ear | 行粒数 Kernel number per row | 千粒重 1000-grain weight (g) | 产量 Yield (t/hm2) | 收获指数 Harvest index |
|---|---|---|---|---|---|
| 密度Density | |||||
| D1 | 15.7±0.3a | 36.9±0.6a | 388.48±7.28a | 10.32±0.36e | 0.51±0.02b |
| D2 | 15.3±0.3ab | 35.7±0.6a | 373.58±7.28ab | 10.77±0.36de | 0.55±0.02a |
| D3 | 15.5±0.3a | 35.2±0.6a | 368.08±7.28ab | 11.55±0.36cd | 0.53±0.05ab |
| D4 | 15.3±0.3ab | 35.5±0.6a | 366.78±7.28ab | 12.54±0.36bc | 0.51±0.02b |
| D5 | 15.3±0.3ab | 32.9±0.6b | 366.01±7.28ab | 12.49±0.36bc | 0.50±0.02b |
| D6 | 14.6±0.3b | 32.7±0.6b | 356.19±7.28b | 12.96±0.36b | 0.52±0.04ab |
| D7 | 15.5±0.3a | 33.1±0.6b | 352.56±7.28b | 14.49±0.36a | 0.51±0.01bc |
| 品种Variety | |||||
| ZD309 | 14.6±0.2b | 33.9±0.5b | 369.64±5.5a | 11.67±0.27c | 0.52±0.05ab |
| ZD326 | 14.5±0.2b | 33.3±0.5b | 364.37±5.5a | 11.19±0.27c | 0.53±0.02a |
| ZD958 | 14.6±0.2b | 35.8±0.5a | 368.13±5.5a | 12.50±0.27b | 0.51±0.03ab |
| ZY303 | 17.6±0.2a | 35.2±0.5a | 367.39±5.5a | 13.29±0.27a | 0.51±0.01b |
| F检验F test | |||||
| 密度Density | ns | ** | * | ** | ns |
| 品种Variety | ** | ** | ns | ** | ns |
| 密度×品种Density×variety | ns | ns | ns | * | ns |
从表4可以看出,各密度下ZY303的穗行数最高,D2ZD958行粒数最高(38.6),除D2ZD326、D3ZD309、D3ZD326、D5ZD309和D5ZD326处理外,D1、D2、D3、D4和D5处理下其他各处理与之无显著差异。D7ZD326处理行粒数最低,为30.3。D1ZY303处理千粒重最高,为409.17g,D6ZY303和D7ZY303处理最低,分别为343.07和343.87g。D7ZY303处理产量最高,其次是D7ZD958,D2ZD326处理产量最低,为9.48t/hm2。D3ZD326处理收获指数最高,为0.64,其次是D2ZD958和D6ZD309处理,以D7和D4处理下ZD958的收获指数最低,分别为0.42和0.43。
表4 不同密度和品种对夏玉米籽粒产量及其构成因素的影响
Table 4
| 密度 Density | 品种 Variety | 穗行数 Rows per ear | 行粒数 Kernel number per row | 千粒重 1000-grain weight (g) | 产量 Yield (t/hm2) | 收获指数 Harvest index |
|---|---|---|---|---|---|---|
| D1 | ZD309 | 14.5±0.5bc | 36.9±1.3ab | 392.10±5.82abc | 10.10±0.34ij | 0.48±0.01abc |
| ZD326 | 14.9±0.1bc | 37.0±0.5ab | 380.00±7.26abc | 10.09±0.18ij | 0.55±0.03abc | |
| ZD958 | 15.3±0.4b | 36.9±1.0ab | 372.63±17.70abc | 10.35±0.39hij | 0.52±0.02abc | |
| ZY303 | 18.0±0.0a | 36.9±2.1ab | 409.17±41.12a | 10.75±0.94ghij | 0.48±0.03abc | |
| D2 | ZD309 | 14.7±0.5bc | 34.5±0.6abcde | 379.07±4.76abc | 10.55±0.25ghij | 0.56±0.03abc |
| ZD326 | 14.8±0.8bc | 33.2±0.7bcdef | 362.33±8.84abc | 9.48±0.33j | 0.49±0.01abc | |
| ZD958 | 14.4±0.5bc | 38.6±0.9a | 388.03±8.17abc | 11.89±0.29cdefghij | 0.63±0.04ab | |
| ZY303 | 17.5±0.6a | 36.3±0.5abc | 364.87±12.75abc | 11.15±0.56efghij | 0.53±0.02abc | |
| D3 | ZD309 | 14.8±0.4bc | 33.5±0.5bcdef | 374.47±10.03abc | 10.68±0.54ghij | 0.47±0.04abc |
| ZD326 | 14.4±0.4bc | 34.1±1.0bcdef | 369.40±5.36abc | 10.90±0.41fghij | 0.64±0.04a | |
| ZD958 | 15.2±0.4b | 36.7±0.7ab | 374.47±11.97abc | 12.04±0.63cdefghi | 0.50±0.01abc | |
| ZY303 | 17.7±0.5a | 36.3±0.5abc | 354.00±5.41bc | 12.60±0.28cdefgh | 0.50±0.00abc | |
| D4 | ZD309 | 14.7±0.3bc | 35.8±0.7abcd | 374.30±3.18abc | 12.28±0.07cdefghi | 0.54±0.05abc |
| ZD326 | 14.8±0.6bc | 35.7±0.6abcd | 369.63±4.82abc | 12.80±0.42cdefg | 0.55±0.05abc | |
| ZD958 | 14.5±0.1bc | 34.5±0.5abcde | 364.47±12.72abc | 11.77±0.86cdefghij | 0.43±0.05c | |
| ZY303 | 17.3±0.7a | 36.0±0.7abc | 358.70±7.35bc | 13.31±0.63bcdef | 0.48±0.02abc | |
| D5 | ZD309 | 14.9±0.3bc | 31.0±0.8ef | 347.33±10.62bc | 11.06±0.52fghij | 0.48±0.03abc |
| ZD326 | 14.3±0.4bc | 31.7±3.0def | 361.07±17.90abc | 11.33±0.90defghij | 0.47±0.04abc | |
| ZD958 | 14.4±0.5bc | 34.6±1.6abcde | 357.57±12.37bc | 13.49±0.76bcde | 0.5±0.06abc | |
| ZY303 | 17.5±0.5a | 34.5±1.0abcde | 398.07±43.93ab | 14.07±0.76bc | 0.55±0.04abc | |
| D6 | ZD309 | 14.0±0.0bc | 33.9±1.4bcdef | 368.60±12.87abc | 13.71±0.93bcd | 0.62±0.09ab |
| ZD326 | 14.0±0.7bc | 31.2±0.6ef | 356.33±5.48bc | 11.82±0.63cdefghij | 0.45±0.04bc | |
| ZD958 | 13.3±1.3c | 33.1±1.5bcdef | 356.77±5.05bc | 12.71±0.70cdefgh | 0.54±0.05abc | |
| ZY303 | 17.2±0.5a | 32.4±1.1cdef | 343.07±5.60c | 13.62±0.26bcd | 0.48±0.04abc | |
| D7 | ZD309 | 14.7±0.5bc | 31.8±1.5def | 351.60±12.20bc | 13.28±1.75bcdef | 0.52±0.08abc |
| ZD326 | 14.3±0.1bc | 30.3±2.3f | 351.80±5.89bc | 11.91±1.24cdefghij | 0.54±0.08abc | |
| ZD958 | 14.8±0.8bc | 35.8±0.8abcd | 362.97±1.19abc | 15.24±1.12b | 0.42±0.03c | |
| ZY303 | 18.1±0.4a | 34.4±1.2bcdef | 343.87±2.50c | 17.53±0.48a | 0.55±0.02abc |
3 讨论
不同品种对密度的响应不同,研究[24]表明,大穗型品种在低密度下单株干物质累积量较大,随密度增加显著下降,群体干物质量则先增加后降低,小穗型品种的群体干物质量则持续增加。随密度增加,平展型玉米品种积累的干物质在果穗和茎叶间分配比例变化较大,干物质多倾向分配于茎叶,而紧凑型的变化较小。在本研究条件下,随着种植密度的增加,中玉303的产量不断提高,在密度为10.50×10⁴株/hm2时产量最高(17.53t/hm2),表明中玉303为耐密型品种。本试验研究结果可为进一步研究不同玉米品种对种植密度的生理响应和养分利用效率规律等提供参考。
4 结论
玉米种植密度对其生长发育及产量有着重要的影响。随着种植密度的增加,籽粒植株干物质量显著增加,花后干物质量占成熟期的比重则降低。成熟期千粒重随密度的增加而降低,本研究表明,4个品种中以中玉303的产量最高,尤其是在10.50×10⁴株/hm2下产量表现最好。因此,在本试验区域内,以10.50×104株/hm2高密度种植中玉303能够实现夏玉米增密高产。
参考文献
Maize transpiration efficiency increases with N supply or higher plant densities
DOI:10.1016/j.agwat.2021.106816 URL [本文引用: 1]
High-density mapping for gray leaf spot resistance using two related tropical maize recombinant inbred line populations
DOI:10.1007/s11033-021-06350-9
PMID:33890197
[本文引用: 1]

Gray leaf spot (GLS) caused by Cercospora zeae-maydis or Cercospora zeina is one of the devastating maize foliar diseases worldwide. Identification of GLS-resistant quantitative trait loci (QTL)/genes plays an urgent role in improving GLS resistance in maize breeding practice. Two groups of recombinant inbred line (RIL) populations derived from CML373 × Ye107 and Chang7-2 × Ye107 were generated and subjected to genotyping-by-sequencing (GBS). A total of 1,929,222,287 reads in CML373 × Ye107 (RIL-YCML) and 2,585,728,312 reads in Chang7-2 × Ye107 (RIL-YChang), with an average of 10,961,490 (RIL-YCML) and 13,609,096 (RIL-YChang) reads per individual, were got, which was roughly equal to 0.70-fold and 0.87-fold coverage of the maize B73 RefGen_V4 genome for each F individual, respectively. 6418 and 5139 SNP markers were extracted to construct two high-density genetic maps. Comparative analysis using these physically mapped marker loci demonstrated a satisfactory colinear relationship with the reference genome. 11 GLS-resistant QTL have been detected. The individual QTL accounted for 1.53-24.00% of the phenotypic variance explained (PVE). The new consensus QTL (qYCM-DS3-3/qYCM-LT3-1/qYCM-LT3-2) with the largest effect was located in chromosome bin 3.05, with an interval of 2.7 Mb, representing 13.08 to 24.00% of the PVE. Further gene annotation indicated that there were four candidate genes (GRMZM2G032384, GRMZM2G041415, GRMZM2G041544, and GRMZM2G035992) for qYCM-LT3-1, which may be related to GLS resistance. Combining RIL populations and GBS-based high-density genetic maps, a new larger effect QTL was delimited to a narrow genomic interval, which will provide a new resistance source for maize breeding programs.
Optimizing irrigation and planting density of spring maize under mulch drip irrigation system in the arid region of northwest China
DOI:10.1016/j.fcr.2021.108141 URL [本文引用: 1]
Nutrient accumulation and remobilization in relation to yield formation at high planting density in maize hybrids with different senescent characters
DOI:10.1080/03650340.2020.1737678 URL [本文引用: 1]
Evaluating the performance of the lines and their half diallel cross in maize (Zea mays L.)
不同密度混播对玉米植株13C同化物分配和产量的影响
DOI:10.13287/j.1001-9332.201810.021
[本文引用: 1]
为了探讨不同密度混播对玉米植株<sup>13</sup>C同化物分配和产量的影响,选用‘郑单958’(ZD)和‘登海605’(DH)为试验材料,在不同密度下(LD,67500株·hm<sup>-2</sup>;HD,97500株·hm<sup>-2</sup>)设置单播(SZD、SDH)与混播(M、1∶1、2∶2)处理,研究玉米品种不同密度混播对植株光合特性、<sup>13</sup>C同化物分配、干物质积累量和产量的影响.结果表明: 随密度增加,籽粒产量、<sup>13</sup>C同化物在籽粒中的分配、干物质积累量和叶面积指数均提高;而叶绿素含量和净光合速率则降低.在67500株·hm<sup>-2</sup>下,混播较单播处理无显著优势,但在97500株·hm<sup>-2</sup>下,两品种混播提高了叶面积指数、叶绿素含量和穂位叶净光合速率,干物质积累量增加.混播促进茎等营养器官的干物质向籽粒的转运,提高了<sup>1</sup><sup>3</sup>C同化物在籽粒中的分配比例.混播处理较单播产量增加,主要因为千粒重显著增加.在高密度种植条件下,混播有助于扩大光合面积,维持较高的净光合速率,提高群体干物质积累量,改善干物质的分配状况,增加同化物向籽粒的分配,最终提高夏玉米产量.可见,混播栽培可显著增加黄淮海区密植夏玉米产量.
The impact of high plant density on dry matter remobilization and stalk lodging in maize genotypes with a different stay-green degree
DOI:10.1080/03650340.2020.1737679 URL [本文引用: 1]
