


目前,多数研究[6]都基于生理生化指标来筛选和评价小麦品种的耐渍性。Poysa[7]以渍害胁迫下小麦幼苗的存活率为耐渍筛选指标;曹旸等[8]则以主茎绿色叶片的枯衰程度为筛选指标;Wang等[2]通过比较渍水处理前后乙烯生物合成相关蛋白及光合速率变化筛选耐渍品种。Malik等[9]认为渍水严重影响根的生长速率、降低不定根数量和净光合速率,根据根生长速率、不定根数量和光合速率可筛选耐渍种质资源。在此基础上,Boru等[10]结合植株高度、生物量、产量和粒重等指标筛选耐渍品种。也有研究者[11-12]以光合参数筛选耐渍品种(系),如叶水势、气孔导度、光合速率、叶绿素荧光参数、根密度和酶活性等。研究[13]发现,分蘖后期渍害导致平均产量下降34%,穗粒重降低,降幅在16%~ 49%。Wu等[14]同样发现,拔节期分别渍水2周和4周,造成小麦产量分别下降20.7%和22.4%。小麦分蘖到生殖阶段对渍水敏感,该阶段渍害导致其生理和代谢紊乱,生长、发育延迟,产量降低[15]。Pampana等[16]研究表明,产量是筛选耐渍品种(系)简单易行且重要的指标。渍水胁迫下,产量相关的指标对小麦产量和总生物量都有很高的预测作用,可以高通量地筛选耐渍品种[17]。刘杨等[18]发现,不同发育时期的渍害对产量构成要素影响的差异较大,拔节期渍害对产量的影响较为显著,产量可以作为耐渍筛选的重要依据。Raman等[19]利用产量指数筛选到耐干旱胁迫的高产水稻品系。Rosielle等[20]将逆境下均产(Ys)与非逆境下均产(Yp)间的差异定义为抗逆力(TOL),将逆境和非逆境下产量的均值定义为平均生产力(MP),以此判断不同品种的抗逆能力。Fernandez[21]采用耐胁迫指数(STI)鉴定非逆境下高产的基因型品种。有研究[22-23]认为,采用生产力几何平均值(GMP)判断不同基因型品种的抗逆性更合理。Abdolshahi等[24]采用胁迫敏感指数(SSI)、MP、TOL、STI和GMP筛选到产量稳定的耐干旱面包小麦品种。这些研究结果表明,以产量相关指标评价或筛选抗逆品种是一种有效方法。至今,国内外已有很多关于小麦渍害对表型性状和产量影响的研究,但是耐渍筛选主要采用表型指标,并且是不同生育期的表型指标,采用产量相关的指标筛选小麦耐渍品种的报道尚少。本研究以34份不同小麦品种(系)为材料,根据各品种产量相关指标评价拔节期小麦耐渍性,建立一种快速简单的耐渍评价方法,为小麦耐渍种质的筛选提供参考。
1 材料与方法
1.1 试验材料
34份供试材料均由国家现代农业技术产业技术体系提供,详见表1。其中扬麦25为耐渍对照,郑麦1354为不耐渍对照。
表1 试验小麦品种(系)和来源
Table 1
| 来源Source | 品种(系)Variety (line) |
|---|---|
| 四川Sichuan | 川麦42,蜀麦1610,绵麦56,绵麦1419,国豪麦5号,国豪麦6号,T61749 |
| 湖北Hubei | 鄂麦166,鄂麦6030,鄂麦6046,鄂麦6087 |
| 河南Henan | 信麦129,信麦176,信麦181,郑麦1354 |
| 安徽Anhui | 安农170,皖科125,皖麦616,皖西麦7号 |
| 江苏南京Nanjing, Jiangsu | 华麦1061,华麦1062,华麦1063,华麦1064,宁麦1624,宁麦9号 |
| 江苏里下河Lixiahe, Jiangsu | 扬11品19,扬15-133,扬16-157,扬16品10,扬辐麦5054,扬辐麦5059,扬辐麦6246,扬麦25,扬麦20 |
1.2 试验方法
试验于2017-2018年在江苏省农业科学院六合试验基地开展。根据Arguello等[17]方法设置渍水栽培大棚,棚内砌池,高0.30m,便于渍水处理。大棚仅保留顶部遮雨塑料膜,四周通风。采用裂区试验设计,渍水和正常栽培构成主区组,品种(系)构成子区组,3次重复。每小区3行,行长2.00m,行距0.25m。将34个小麦材料进行发芽试验,根据发芽率和85%的田间出苗率计算每行的播量。为保证34份试验材料同一时期段拔节,根据各材料拔节期适当分期播种。
生长和肥水管理参照大田标准,施硫酸钾型复合肥(N:P:K=18:18:18)144kg/hm2,60%作为基肥,40%于处理后施肥。于2018年2月24日小麦拔节期进行渍水处理,池内灌水,保持地表水深0.03m,渍水2周,2周后排掉池内水,其余生长阶段管理同大田。
1.3 测定指标及方法
收获每个小区,每小区单独脱粒,烘干至籽粒水分13%,称重测产(kg/m2)。采用单籽粒谷物分析仪(Single Kernel Characterization System,SKCS4100,美国)测定千粒重和粒径。
GMP=(Ys×Yp)0.5[21],式中,Ys是在渍害胁迫下的均产,Yp是在正常无渍害条件下的均产;
MP=(Ys+Yp)/2[24];
调和平均数(HM)=2(Yp×Ys)/(Yp+Ys)[23];
平均相对生产力(MRP)=(Ys/Xs)+(Yp/Xp)[24],式中,Xs是所有材料在渍害胁迫下的均产,Xp是所有材料在正常无渍害条件下的均产;
相对生产力(RP)=Ys/[24],式中,是种植在某一材料两端对照品种的均产;
STI=(Ys×Yp)/(Xp)2[21];
SSI=(1-Ys/Yp)/(1-s/p)[23];
TOL=Yp-Ys[22];
耐湿指数(WTI)=Ys/Yp[23];
耐胁迫得分(STS)=GMP+HM+MP+STI+WTI+ RP-TOL-SSI[24]。
1.4 数据处理
根据Abdolshahi等[24]的指数算法稍作修改,采用Excel计算各指数和标准化处理。用SPSS 18.0进行方差分析、Sperman相关分析和因子分析。
2 结果与分析
2.1 渍水胁迫处理下小麦产量、千粒重和粒径的方差分析及千粒重与粒径的相关分析
表2 品种(系)和渍水处理对小麦籽粒性状影响的方差分析
Table 2
| 变异来源 Source | 自由度 df | 均方MS | ||
|---|---|---|---|---|
| 籽粒产量 Grain yield | 千粒重 1000-grain weight | 粒径 Grain diameter | ||
| 品种(系)Variety (line) | 33 | 0.03* | 56.71* | 0.07* |
| 处理Treatment | 1 | 1.14* | 1184.91* | 0.94* |
| 区组Group | 2 | 0.01 | 0.44 | 0.001 |
| 品种(系)×处理 Variety (line)×treatment | 33 | 0.01* | 10.71* | 0.01* |
| 区组×处理Group×treatment | 2 | 0.02 | 59.01* | 0.10* |
“*”表示P < 0.05显著水平
“*”indicates significance at P < 0.05 level
图1
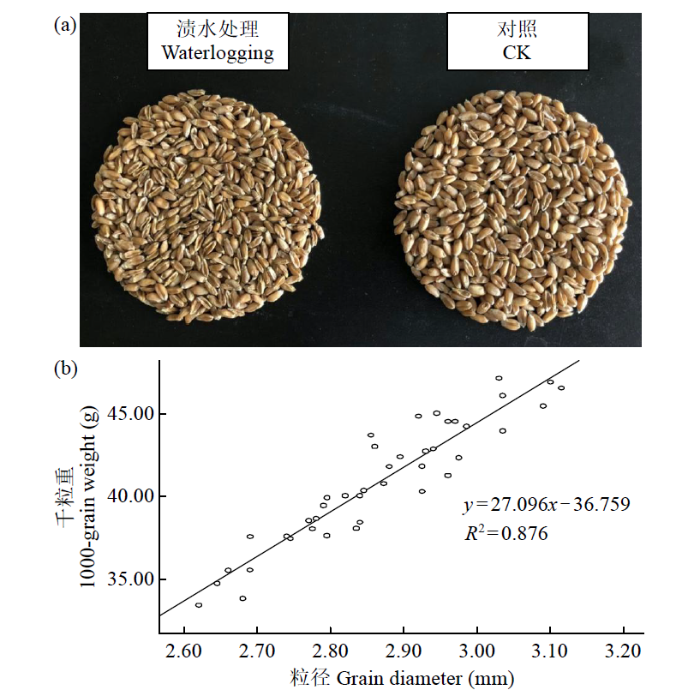
图1
各处理籽粒对比及千粒重与粒径相关性分析
Fig.1
Comparison of each treatment grain and analysis of correlation between 1000-grain weight and grain diameter
方差分析结果(表2)表明,品种(系)间对渍水的响应存在差异,导致渍水处理后各品种(系)的产量、千粒重和粒径差异显著,表明品种(系)间的耐渍性存在显著差异性。渍水处理组和常规组间的产量、千粒重和粒径差异显著,表明渍水对产量影响较为显著;粒径与千粒重的相关分析表明,粒径和千粒重显著相关,粒径减小导致千粒重降低可能是造成产量降低的原因之一。
2.2 不同指标间的相关性分析
由表3可知,Yp与SSI和WTI无显著相关性,与其他指标均有显著相关性。MP与TOL无显著相关性,其他指标均存在显著相关性。STI、GMP、MP、HM、MRP、RP与Yp和Ys显著正相关,而SSI、WTI、TOL与Ys呈显著负相关,TOL与Yp显著负相关。相关分析结果表明,STI、GMP、MP、HM、MRP、RP与渍水和常规环境下品种的产量高度相关,SSI、WTI、TOL于渍水胁迫环境下品种(系)的产量高度相关。
表3 指标间的相关性分析
Table 3
| 指标Index | Ys | Yp | STI | SSI | GMP | MP | WTI | TOL | HM | MRP | RP |
|---|---|---|---|---|---|---|---|---|---|---|---|
| Ys | 1.00 | ||||||||||
| Yp | 0.37* | 1.00 | |||||||||
| STI | 0.91** | 0.73** | 1.00 | ||||||||
| SSI | -0.77** | 0.30 | -0.44** | 1.00 | |||||||
| GMP | 0.91** | 0.73** | 0.99** | -0.44** | 1.00 | ||||||
| MP | 0.88** | 0.77** | 0.99** | -0.38** | 0.99** | 1.00 | |||||
| WTI | -0.77** | -0.30 | 0.44** | -1.00** | 0.44** | 0.38** | 1.00 | ||||
| TOL | -0.72** | 0.38* | -0.36* | -0.99** | -0.36** | -0.29 | -0.99** | 1.00 | |||
| HM | 0.93** | 0.68** | 0.99** | -0.49** | 0.99** | 0.99** | 0.49** | -0.42** | 1.00 | ||
| MRP | 0.90** | 0.74** | 0.99** | -0.43** | 1.00** | 0.99** | 0.43** | -0.34** | 0.99** | 1.00 | |
| RP | 0.88** | 0.38* | 0.83** | -0.65** | 0.83** | 0.80** | 0.65** | -0.59** | 0.85** | 0.99** | 1.00 |
“*”表示P < 0.05的显著水平,“**”表示P < 0.01的显著水平
“*”indicates significance at P < 0.05 level,“**”indicates significance at P < 0.01 level
2.3 耐渍性评价指标的因子分析
由表4看出,因子分析共提取了2个因子,解释总变异的97.85%。因子1主要解释GMP、HM、MP、WTI和RP,表明生产力的上述指标与因子1密切相关;因子2主要解释SSI、TOL和STI,表明上述指标与因子2密切相关。因子1主要反映了产量特性,因子2主要反映了耐胁迫特性,即耐渍特性。GMP、HM、MP、WTI和RP适宜选择正常和渍水胁迫环境下产量稳定的基因型品种(系),SSI、TOL和STI适宜选择耐渍性强的基因型品种(系)。因此,各品种(系)因子1和2的综合得分反映了渍水胁迫下的产量稳定性和耐渍性。GMP、HM、MP、STI、WTI和RP被提取的比例均在0.85以上,共性较大,被因子解释程度高,可用于对各品种(系)的初步筛选。
表4 指数的因子载荷和因子解释的总变异
Table 4
| 指标 Index | 因子载荷Factor loading | 共同度 Communality | |
|---|---|---|---|
| 因子1 FA1 | 因子2 FA2 | ||
| GMP | 0.95 | 0.32 | 0.97 |
| HM | 0.96 | 0.26 | 0.86 |
| MP | 0.92 | 0.38 | 0.96 |
| MRP | 0.74 | 0.34 | 0.72 |
| SSI | -0.70 | 0.71 | 0.79 |
| WTI | 0.94 | 0.32 | 0.92 |
| TOL | -0.64 | 0.77 | 0.75 |
| RP | 0.91 | -0.05 | 0.94 |
| STI | 0.70 | -0.71 | 0.90 |
| 变异Variance (%) | 74.11 | 23.74 | |
| 累计变异 Cumulative variance (%) | 74.11 | 97.85 | |
2.4 各品种(系)GMP、HM、MP、STI、WTI和RP的得分
根据表4计算各品种(系)的STI、GMP、MP、HM、WTI和RP分值。表5列出了分值前18位的品种(系),GMP、HM、MP、STI的前18位品种(系)基本相同,WTI和RP前18个品种(系)与GMP、HM、MP和STI稍有不同。国豪麦6号GMP、HM、MP、STI和RP得分最高,表明其耐渍性较好且稳定。耐渍对照品种扬麦25的GMP、HM、MP和STI得分在0.20~0.30,扬麦25的WTI和RP得分分别为0.79和0.61,GMP、HM、MP和STI值相差不大,表明GMP、HM、MP和STI作为耐渍评价指标较为稳定,可筛选大部分的耐渍品种;WTI作为耐渍评价指标较为严苛,可筛选耐渍性较强的品种;RP作为耐渍评价指标适中,可筛选耐渍性中等以上的品种。在这6个耐渍指标中,国豪麦6号、扬16-157和扬15-133的6个指标值均大于扬麦25,华麦1064、华麦1063、华麦1061、宁麦9号、扬麦20和皖科125的5个指标值大于扬麦25,表明国豪麦6号、扬16-157、扬15-133、华麦1064、华麦1063、华麦1061、宁麦9号、扬麦20和皖科125有较好的耐渍性。
表5 基于GMP、HM、MP、STI、WTI和RP评分的前18个品种(系)及得分
Table 5
| 序号Number | GMP | HM | MP | STI | WTI | RP |
|---|---|---|---|---|---|---|
| 1 | 国豪麦6号(1.88) | 国豪麦6号 (1.87) | 国豪麦6号 (1.89) | 国豪麦6号 (2.00) | 扬麦20 (1.42) | 国豪麦6号 (2.48) |
| 2 | 华麦1064 (1.70) | 扬15-133 (1.69) | 华麦1064 (1.72) | 华麦1064 (1.78) | 华麦1061 (1.24) | 扬16-157 (1.75) |
| 3 | 扬15-133 (1.70) | 华麦1064 (1.67) | 扬15-133 (1.70) | 扬15-133 (1.78) | 扬11品19 (1.17) | 扬15-133 (1.69) |
| 4 | 扬16-157 (1.38) | 扬16-157 (1.38) | 鄂麦166 (1.37) | 扬16-157 (1.42) | 川麦42 (1.13) | 华麦1064 (1.64) |
| 5 | 鄂麦166 (1.37) | 鄂麦166 (1.38) | 扬16-157 (1.37) | 鄂麦166 (1.41) | 信麦129 (1.06) | 信麦129 (0.94) |
| 6 | 扬麦20 (1.22) | 扬麦20 (1.24) | 扬麦20 (1.20) | 扬麦20 (1.25) | 扬16-157 (0.84) | 宁麦9号 (0.87) |
| 7 | 宁麦9号 (1.05) | 宁麦9号 (1.04) | 宁麦9号 (1.06) | 宁麦9号 (1.06) | 国豪麦6号 (0.80) | 华麦1063 (0.77) |
| 8 | 华麦1061 (0.97) | 华麦1061 (0.99) | 华麦1061 (0.94) | 华麦1061 (0.97) | 扬15-133 (0.79) | 皖科125 (0.77) |
| 9 | 安农170 (0.91) | 安农170 (0.93) | 安农170 (0.89) | 安农170 (0.91) | 扬麦25 (0.79) | 扬11品19 (0.70) |
| 10 | 皖科125 (0.90) | 皖科125 (0.90) | 皖科125 (0.89) | 皖科125 (0.89) | 鄂麦166 (0.71) | 川麦42 (0.65) |
| 11 | 华麦1063 (0.72) | 华麦1063 (0.74) | 华麦1063 (0.70) | 华麦1063 (0.70) | 安农170 (0.68) | 扬麦25 (0.61) |
| 12 | 扬16品10 (0.50) | 鄂麦6046 (0.44) | 扬16品10 (0.63) | 扬16品10 (0.47) | 鄂麦6030 (0.63) | 扬麦20 (0.58) |
| 13 | 鄂麦6046 (0.45) | 扬16品10 (0.39) | 鄂麦6046 (0.46) | 鄂麦6046 (0.42) | 华麦1063 (0.47) | 鄂麦6046 (0.43) |
| 14 | 扬辐麦5054 (0.36) | 扬麦25 (0.31) | 扬辐麦5054 (0.44) | 扬辐麦5054 (0.32) | 鄂麦6087 (0.39) | 鄂麦166 (0.35) |
| 15 | 扬辐麦6246 (0.33) | 扬辐麦5059 (0.30) | 扬辐麦6246 (0.37) | 扬辐麦6246 (0.29) | 皖麦616 (0.27) | 华麦1061 (0.32) |
| 16 | 扬辐麦5059 (0.28) | 扬辐麦6246 (0.29) | 扬辐麦5059 (0.25) | 扬辐麦5059 (0.24) | 扬辐麦5059 (0.26) | 鄂麦6087 (0.26) |
| 17 | 扬麦25 (0.27) | 扬辐麦5054 (0.29) | 扬麦25 (0.23) | 扬麦25 (0.23) | 皖科125 (0.23) | 扬16品10 (0.20) |
| 18 | 鄂麦6087 (0.10) | 鄂麦6087 (0.13) | 鄂麦6087 (0.06) | 鄂麦6087 (0.06) | 宁麦1624 (0.21) | 扬辐麦6246 (0.13) |
2.5 不同小麦品种(系)耐渍性的综合评价
由表6可知,13个品种(系)的综合得分大于或等于对照扬麦25。国豪麦6号的综合得分最高(1.60),扬15-133、华麦1064、扬15-157和鄂麦166的综合得分大于1.00,宁麦9号、扬麦20、华麦1061、皖科125、安农170和华麦1063的综合得分在0.50~1.00,鄂麦6046、扬16品10和扬麦25的综合得分在0.29~0.50,表明综合得分在0.29以上的品种(系)的耐渍性存在一定差异。STS综合了与产量特性和耐渍特性密切相关的指标,其大小反映耐渍能力。从STS排序可知,11个品种(系)的STS得分大于扬麦25。国豪麦6号得分最高(12.48),扬15-133得分大于10.00,扬16-157、扬麦20和华麦1064在9.00~10.00,鄂麦166和华麦1061在7.00~8.00,安农170、宁麦9号、华麦1063、皖科125和扬麦25的得分在4.00~6.00。除鄂麦6046和扬16品10外,STS与因子分析的综合得分的品种(系)相同,表明这2种方式筛选到国豪麦6号、扬15-133、扬16-157、扬麦20、华麦1064、鄂麦166、华麦1061、安农170、宁麦9号、华麦1063和皖科125为耐渍品种(系)。综合得分大于0.30或者STS大于4.00为耐渍品种,但STS方法更简单易行。
表6 因子分析综合得分和STS
Table 6
| 排序 Ranking | 因子分析综合得分 Factor comprehensive score | STS |
|---|---|---|
| 1 | 国豪麦6号 (1.60) | 国豪麦6号 (12.48) |
| 2 | 扬15-133 (1.39) | 扬15-133 (10.90) |
| 3 | 华麦1064 (1.35) | 扬16-157 (9.80) |
| 4 | 扬16-157 (1.18) | 扬麦20 (9.73) |
| 5 | 鄂麦166 (1.02) | 华麦1064 (9.02) |
| 6 | 扬麦20 (0.98) | 鄂麦166 (7.99) |
| 7 | 宁麦9号 (0.82) | 华麦1061 (7.90) |
| 8 | 华麦1061 (0.77) | 安农170 (5.72) |
| 9 | 皖科125 (0.70) | 宁麦9号 (5.47) |
| 10 | 安农170 (0.67) | 华麦1063 (5.06) |
| 11 | 华麦1063 (0.60) | 皖科125 (5.00) |
| 12 | 鄂麦6046 (0.34) | 扬麦25 (4.05) |
| 13 | 扬16品10 (0.29) | 信麦129 (3.19) |
| 14 | 扬麦25 (0.29) | 扬11品19 (1.91) |
| 15 | 扬辐麦6246 (0.20) | 川麦42 (1.83) |
| 16 | 扬辐麦5054 (0.18) | 鄂麦6087 (1.82) |
| 17 | 扬辐麦5059 (0.14) | 鄂麦6046 (1.40) |
| 18 | 鄂麦6087 (0.11) | 扬辐麦5059 (1.30) |
| 19 | 宁麦1624 (0.01) | 宁麦1624 (0.64) |
| 20 | 信麦129 (-0.01) | 信麦176 (-0.55) |
| 21 | 信麦176 (-0.09) | 扬辐麦6246 (-0.56) |
| 22 | T61749 (-0.15) | 扬辐麦5054 (-1.81) |
| 23 | 川麦42 (-0.25) | 扬16品10 (-1.99) |
| 24 | 扬11品19 (-0.26) | T61749 (-2.15) |
| 25 | 郑麦1354 (-0.41) | 郑麦1354 (-4.03) |
| 26 | 国豪麦5号 (-0.50) | 皖麦616 (-4.28) |
| 27 | 绵麦56 (-0.69) | 鄂麦6030 (-5.15) |
| 28 | 皖科616 (-0.83) | 国豪麦5号 (-5.32) |
| 29 | 华麦1062 (-1.03) | 信麦181 (-8.90) |
| 30 | 鄂麦6030 (-1.12) | 绵麦56 (-9.94) |
| 31 | 蜀麦1610 (-1.30) | 蜀麦1610 (-10.27) |
| 32 | 皖西麦7号 (-1.35) | 华麦1062 (-11.48) |
| 33 | 信麦181 (-1.38) | 皖西麦7号 (-13.94) |
| 34 | 绵麦1419 (-1.56) | 绵麦1419 (-16.22) |
STS表示耐胁迫得分,STS=GMP+HM+MP+STI+WTI+RP-TOL-SSI
STS indicates stress tolerance scores, STS=GMP+HM+MP+STI+ WTI+RP-TOL-SSI
3 讨论
作物不仅要有渍水胁迫下生存的能力,而且要有可收获的产量[28]。基于逆境胁迫和正常环境之间产量的数学关系,不同指标被用于鉴定耐胁迫的种质资源[29]。渍水胁迫下一个基因型品种相对于正常条件的MP[30]以及SSI[31]常被用于评估耐渍性的指标。GMP[22]和STI[21]也常用于耐渍评价。Abdolshahi等[24]研究发现,STI、MP和GMP指数可用于筛选干旱和正常条件下高产的品种。GMP、MP、HM和STI是适合筛选渍水环境下耐渍基因型的优选指标[23]。本研究发现,STI、GMP、MP、HM、MRP和RP与Yp和Ys呈显著正相关,其中SSI、WTI和TOL与Ys和Yp呈显著负相关(表3);GMP、HM、MP、WTI和RP适宜选择正常和渍水胁迫环境下产量稳定的品种,SSI、TOL和STI适宜选择耐渍能力强的品种。这与Abdolshahi等[24]的结果一致,与Singh等[23]的结果稍有不同,Singh等[23]通过相关分析和各品种的指数得分说明GMP、MP、HM和STI适宜筛选耐渍品种,本研究通过因子分析发现,GMP、HM、MP、WTI、RP、SSI、TOL和STI能够反映渍水胁迫的产量潜力和耐渍能力,更充分和全面。
根据因子分析可知,GMP、HM、MP、STI、WTI和RP因子解释的程度高,可用于耐渍的初步筛选。由GMP、HM、MP、STI、WTI和RP的得分可以看出,豪麦6号、扬16-157、扬15-133、华麦1064、华麦1063、华麦1061、宁麦9号、扬麦20和皖科125耐渍性较强。因子分析的综合得分和STS得分可以看出,国豪麦6号、扬15-133、扬16-157、扬麦20、华麦1064、鄂麦166、华麦1061、安农170、宁麦9号、华麦1063和皖科125大于耐渍对照,包括了初步筛选的所有品种(系)。进一步验证了结果的可靠性。综合得分为0.30或STS 4.00以上为耐渍品种(系)。另外,品种(系)间存在差异,表明筛选到的品种(系)包含耐渍性较强和耐渍性中等的品种(系),综合分值和STS越高者可能耐渍性越强。这与Abdolshahi等[24]耐旱的研究结论一致。本研究发现,用STS值筛选耐渍品种(系)更为快速简洁,为耐渍筛选提供了一种更简便的筛选方法,得到的11个耐渍品种(系)可用作耐渍基因型的供体资源。
4 结论
粒径与千粒重显著相关,粒径减小是导致千粒重降低的原因之一;GMP、HM、MP、STI、WTI和RP可用于耐渍的初步筛选,且STS大于4.00或综合得分大于0.30为耐渍品种(系);国豪麦6号、扬15-133、扬16-157、扬麦20、华麦1064、鄂麦166、华麦1061、安农170、宁麦9号、华麦1063和皖科125 STS和综合得分高于耐渍对照扬麦25,为耐渍品种(系)。
参考文献
Lack of interaction between extreme high-temperature events at vegetative and reproductive growth stages in wheat
DOI:10.1046/j.1439-037X.2003.00025.x
URL
[本文引用: 1]

Increased climatic variability and more frequent episodes of extreme conditions may result in crops being exposed to more than one extreme temperature event in a single growing season and could decrease crop yields to the same extent as changes in mean temperature. The developmental stage of the crop exposed to increased temperatures will determine the severity of possible damage experienced by the plant. It is not known whether or not the damaging effects of heat episodes occurring at different phenological stages are additive. In the present study, the interaction of high‐temperature events applied at the stages of double ridges and anthesis in Triticum aestivum (L.) cv. Chablis was investigated. Biomass accumulation of control plants and that of plants experiencing high temperatures during the double‐ridge stage were similar and were reduced by 40 % when plants were subjected to a heat event at anthesis. Grain number on the main and side tillers declined by 41 %, and individual grain weight declined by 45 % with heat stress applied at the double‐ridge stage and anthesis or at anthesis alone. The harvest index was reduced from 0.53 to 0.33. Nitrogen contents in leaves were reduced by 10 % at the double‐ridge stage and by 25 % at anthesis. The maximum rates of CO2 assimilation increased with heat stress at the double‐ridge stage and higher rates were maintained throughout the growing season. The results clearly indicate that an extreme heat event at the double‐ridge stage does not affect subsequent growth or the response of wheat to heat stress at anthesis.
Physiological and proteomic mechanisms of waterlogging priming to improves tolerance to waterlogging stress in wheat (Triticum aestivum L.)
DOI:10.1016/j.envexpbot.2016.09.003 URL [本文引用: 2]
QTLs for waterlogging tolerance at germination and seedling stages in population of recombinant inbred lines derived from a cross between synthetic and cultivated wheat genotypes
DOI:10.1016/S2095-3119(13)60354-8
[本文引用: 1]
Waterlogging is a widespread limiting factor for wheat production throughout the world. To identify quantitative trait loci (QTLs) associated with waterlogging tolerance at early stages of growth, survival rate (SR), germination rate index (GRI), leaf chlorophyll content index (CCI), root length index (RLI), plant height index (PHI), root dry weight index (RDWI), shoot dry weight index (SDWI), and total dry weight index (DWI) were assessed using the International Triticeae Mapping Initiative (ITMI) population W7984/Opata85. Significant and positive correlations were detected for all traits in this population except RLI. A total of 32 QTLs were associated with waterlogging tolerance on all chromosomes except 3A, 3D, 4B, 5A, 5D, 6A, and 6D. Some of the QTLs explained large proportions of the phenotypic variance. One of these is the QTL for GRI on 7A, which explained 23.92% of the phenotypic variation. Of them, 22 alleles from the synthetic hexaploid wheat W7984 contributed positively. These results suggested that synthetic hexaploid wheat W7984 is an important genetic resource for waterlogging tolerance in wheat. These alleles conferring waterlogging tolerance at early stages of growth in wheat could be utilized in wheat breeding for improving waterlogging tolerance.
拔节期渍水对小麦籽粒品质相关性状的影响
DOI:10.11869/j.issn.100-8551.2021.01.0238
[本文引用: 1]
为探讨拔节期渍害对小麦籽粒品质性状的影响,以34份小麦品种(系)为材料,比较了渍水处理和对照组的籽粒特性、面团流变学性状及溶剂保持力(SRC)的变化。结果表明,品种对所调查籽粒的品质性状、面团流变学特性及SRC均有显著或极显著影响,渍水处理对千粒重、峰值面积和峰值时间以及SRC有显著影响。渍水后,籽粒性状中的千粒重和硬度、面团流变学特性中的峰值面积和峰值时间分别较对照下降9.09%、3.76%、6.86%、7.49%,蔗糖SRC值和乳酸SRC值分别较对照降低2.68和4.39个百分点,差异达极显著水平。根据渍水前后的品质变化及相关性分析,上述性状中的千粒重、蔗糖SRC值和乳酸SRC值可以作为小麦品质耐渍性筛选指标。根据K-Means法统计供试小麦品种(系)耐渍性对品质影响的差异,发现宁麦9号、扬16-157、皖西麦7号和鄂麦6046品质耐渍性较好,可作为培育耐渍品种的亲本加以利用。本研究结果为小麦耐渍育种及渍害对小麦生长发育的影响提供了理论依据。
The genetic control of low temperature, ice- encasement, and flooding tolerances by chromosomes 5A, 5B, and 5D in wheat
DOI:10.1556/CRC.36.2008.1.14 URL [本文引用: 1]
Changes in physiological and morphological traits of roots and shoots of wheat in response to different depths of waterlogging
DOI:10.1071/PP01089
URL
[本文引用: 1]
\nThe growth reduction of wheat (Triticum aestivum L.)\nduring and after waterlogging stress depends on the depth of water from the\nsoil surface. In a pot experiment with 3-week-old plants, soil was waterlogged\nfor 14 d at the surface, or at 100 or 200 mm below the surface, and pots were\nthen drained to assess recovery. A fully drained treatment kept at field\ncapacity served as control. During waterlogging, the relative growth rate of\nroots decreased more than that of shoots (by 6–27% for shoots, by\n15–74% for roots), and plant growth was reduced proportionally as\nthe water level was increased. Light-saturated net photosynthesis was reduced\nby 70–80% for the two most severe waterlogging treatments, but\nwas little affected for plants in soil waterlogged at 200 mm below the\nsurface. The number of adventitious roots formed per stem in plants grown in\nwaterlogged soil increased up to 1.5 times, but the number of tillers per\nplant was reduced by 24–62%. The adventitious roots only\npenetrated 85–116 mm below the water level in all waterlogging\ntreatments. Adventitious root porosity was enhanced up to 10-fold for plants\ngrown in waterlogged soil, depending on water level and position along the\nroots. Porosity also increased in basal zones of roots above the water level\nwhen the younger tissues had penetrated the waterlogged zone. Fourteen days\nafter draining the pots, growth rates of plants where the soil had been\nwaterlogged at 200 mm below the surface had recovered, while those of plants\nin the more severely waterlogged treatments had only partially recovered.\nThese findings show that the depth of waterlogging has a large impact on the\nresponse of wheat both during and after a waterlogging event so that\nassessment of recovery is essential in evaluating waterlogging tolerance in\ncrops.\n
Expression and inheritance of tolerance to waterlogging stress in wheat
DOI:10.1023/A:1003929803920 URL [本文引用: 1]
Waterlogging pretreatment during vegetative growth improves tolerance to waterlogging after anthesis in wheat
DOI:10.1016/j.plantsci.2011.01.009 URL [本文引用: 1]
Maintained root length density contributes to the waterlogging tolerance in common wheat (Triticum aestivum L.)
DOI:10.1016/j.fcr.2013.03.020 URL [本文引用: 1]
Effect of waterlogging at different growth stages on some morphological traits of wheat varieties
Individual and combined effects of soil waterlogging and compaction on physiological characteristics of wheat in southwestern China
DOI:10.1016/j.fcr.2017.10.016 URL [本文引用: 3]
Review of prospects for germplasm improvement for waterlogging tolerance in wheat,barley and oats
DOI:10.1023/A:1024573305997 URL [本文引用: 1]
Grain yield of durum wheat as affected by waterlogging at tillering
DOI:10.1556/0806.44.2016.026 URL [本文引用: 1]
Performance of soft red winter wheat subjected to field soil waterlogging: grain yield and yield compoments
DOI:10.1016/j.fcr.2016.04.040 URL [本文引用: 3]
Drought yield index to select high yielding rice lines under different drought stress severities
DOI:10.1186/1939-8433-5-31
[本文引用: 1]
Drought is the most severe abiotic stress reducing rice yield in rainfed drought prone ecosystems. Variation in intensity and severity of drought from season to season and place to place requires cultivation of rice varieties with different level of drought tolerance in different areas. Multi environment evaluation of breeding lines helps breeder to identify appropriate genotypes for areas prone to similar level of drought stress. From a set of 129 advanced rice (Oryza sativa L.) breeding lines evaluated under rainfed drought-prone situations at three locations in eastern India from 2005 to 2007, a subset of 39 genotypes that were tested for two or more years was selected to develop a drought yield index (DYI) and mean yield index (MYI) based on yield under irrigated, moderate and severe reproductive-stage drought stress to help breeders select appropriate genotypes for different environments.
Theoretical aspects of selection for yield in stress and non-stress environment
DOI:10.2135/cropsci1981.0011183X002100060033x
URL
[本文引用: 1]
The question of choice of selection criterion when lines are grown in stress and non‐stress environments is examined from a theoretical standpoint in this paper. Tolerance to stress is defined as the difference in yield between stress and non‐stress environments, while mean productivity is the average yield in stress and non‐stress environments. Equations are developed for the genetic correlations of tolerance and mean productivity with one another and with yields in stress and non‐stress environments in terms of the ratio of genetic variances and the genetic correlations between yields in stress and non‐stress environments. These equations show that selection for tolerance to stress will generally result in a reduced mean yield in non‐stress environments and a decrease in mean productivity. Selection for mean productivity will generally increase mean yields in both stress and non‐stress environments. Tolerance and mean productivity show negative genetic correlations whent he genetic variance in stress environmentsi s less than the genetic variance in non‐stress environments. This result provides an explanation for the positive correlations often reported between regression coefficient stability and mean productivity; a line with high tolerance to stress normally would have a low regression coefficient stability and genetic variances in stress environments are generally lower than in non‐stress enviornments.
Water logging at jointing and/or after anthesis in wheat induces early leaf senescence and impairs grain filling
DOI:10.1016/j.fcr.2012.09.006 URL [本文引用: 2]
Traits related to drought resistance in common bean
DOI:10.1023/A:1018353200015 URL [本文引用: 3]
Germplasm characterization and selection indices in bread wheat for waterlogged soils in India
Screening drought- tolerant genotypes in bread wheat (Triticum aestivum L.) using different multivariate methods
DOI:10.1080/03650340.2012.667080 URL [本文引用: 9]
小麦乙烯转录因子TaERF2响应湿害胁迫的表达分析
DOI:10.11869/j.issn.100-8551.2022.05.0876
[本文引用: 1]
乙烯响应因子在植物非生物胁迫应答中起重要作用。为了解TaERF2在小麦湿害胁迫下作用的分子机理,本研究对TaERF2基因及其编码蛋白序列特征进行分析,并检测TaERF2在不同耐湿品种中的表达特征及原核表达。结果表明,TaERF2基因含有2个外显子和1个内含子,编码355个氨基酸序列,具有典型的AP2/ERF保守结构域和YRG、RAYD基序。AP2/ERF家族转录因子进化和同源比对分析表明,TaERF2属于AP2/ERF家族B2组,与拟南芥AtRAP2.12、AtHRE1和水稻OsSNORKEL1、OsSNORKEL2有较高的同源性,且启动子区域含有缺氧厌氧顺式元件,推测TaERF2可能为湿害胁迫响应基因。湿害胁迫后,TaERF2在小麦根系中特异表达,在耐湿小麦品种宁麦9号根系中的表达显著上调,2~4 h表达量达到最高,然后显著降低,而在不耐湿小麦品种郑麦1354根系中的表达无显著上调。原核表达结果显示,TaERF2可以快速响应ZPTG刺激诱导,与上述宁麦9号根系中的表达模式相似,表明TaERF2在小麦耐湿中具有重要调节作用。本研究为解析小麦耐湿分子调控机制提供了理论参考。
Effects of shading and waterlogging on the photosynthesis and yield performance of winter wheat in Jiangsu province, China
Chlorophyll fluorescence and yield responses of winter wheat to waterlogging at different growth stages
DOI:10.1626/pps.18.284 URL [本文引用: 1]
Determination of the best heat stress tolerance indices in maize (Zea mays L.) inbred lines and hybrids under Khuzestan Province conditions
Evaluation of methods for quantification of drought tolerance in wheat
Drought resistance in spring wheat cultivars. I grain yield responses
DOI:10.1071/AR9780897
URL
[本文引用: 1]
With a view to understanding the basis of cultivar differences in yield under drought, a wide range of cereal cultivars representing durum wheats (Triticum turgidum L.), triticales (X Tritosecale Wittmack), barleys (Hordeum vulgare), and especially tall and dwarf bread wheats (T. aestivum L.) were studied in field experiments in north-western Mexico over three seasons. Drought was created in this rain-free environment by permanently terminating irrigation at various stages before anthesis. Control treatments were well watered throughout the growing period. Detailed measurements of plant water status, leaf area and dry matter production, anthesis date, yield components and grain yield were made. This paper presents primarily the grain yield data. Drought levels were such that the mean yield of all cultivars under drought ranged from 37 to 86% of control yield, corresponding to irrigation cut-offs varying from 69 days before mean anthesis date to only 10 days before. In each experiment the grain yield under drought showed highly significant cultivar differences, which appeared consistent between years. Yields were adjusted for drought escape by using a correction factor which ranged from 2.9 to 8.5 g/m2 per day advance in flowering, being greater in experiments with less severe drought. The demonstration of linear relationships between cultivar yield and drought intensity, as indicated by the mean yield of some or all cultivars, prompted the consideration of cultivar yield under drought as the function of yield potential (Yp, yield without drought), drought susceptibility index (S), and intensity of drought. The cultivar groups showing lowest S values (most droughtresistant) were tall bread wheats and barleys; dwarf bread wheats were intermediate, and durum wheats and triticales were the most susceptible. However, because dwarf wheats have a higher yield potential (Yp) than tall bread wheats, it is suggested that, as a group, tall bread wheats would outyield dwarf wheats only under very severe drought. Also there was considerable within-group variability of S and Yp. Cultivar S values were consistent across experiments. Yield responses of tall and dwarf bread wheat groups obtained in these experiments agreed with those seen in extensive international trials under dryland conditions.
