


作物生产的目标是提高光温资源利用效率和提升作物品种生产潜力,而光温的季节性变化是影响作物生产力[1]和品质形成过程[2]的主要环境因素,何强等[3]通过12种人工控制光温组合处理、短日遮光处理以及分期播种试验,探究了不同水稻品种的育性光温特性,并提出了光温双因子互作量化的光温效应连动假设。但田间试验往往存在时空限制性,而作物模型将光、温、水及土壤等条件作为环境的驱动变量,精细模拟了作物生理生态过程以弥补大田研究的不足[1,4]。WOFOST模型是荷兰瓦赫宁根大学和世界粮食研究中心共同开发研制的通用性作物生长模拟模型[5],以日为步长动态定量模拟小麦[6-7]、玉米[8-9]及水稻[10-11]等多种大田作物生长发育过程。目前,国内外利用WOFOST模型在土壤状况[12]、作物品种[13]和耕作制度[14]等对产量的影响评估方面已得到了广泛应用,提高了试验结果的外推性。黄健熙等[6]在冬小麦主产区分区的基础上,以2012-2015年气象数据驱动WOFOST模型,重点优化WOFOST模型中与品种相关的积温参数,并在站点尺度进行冬小麦物候期、叶面积指数(LAI)和单产动态模拟和精度分析。Roberto等[11]利用1989-2004年6个地点不同灌溉条件下水稻作物数据,比较分析了WOFOST模型对生物量分配、小穗不育性、水肥管理和土壤水文等方面的模型参数敏感性。目前,应用WOFOST模型对我国同一地区内单一水稻品种生长发育过程的适应性研究较多,但忽略了各省份不同水稻品种的适应性[4,15]。此外,在全球气候变暖导致极端天气频发的背景下,水稻生长季后期遭受高温损伤愈发严重[16],这就要求在应用作物模型评估气候变化对水稻生长发育和产量的影响之前,应先通过调参验证来检验模型的准确性和普适性获得适用于该地区不同水稻品种的模型参数,继而评估模型在该地区的适应性。
本研究以江淮地区多省份为研究对象,通过收集分析2006-2012年水稻生长发育和气象数据,对WOFOST模型进行调参验证,确定了关键发育阶段内所需积温、比叶面积、分配系数和枯萎速率等作物遗传参数,并评价了模型在江淮地区的适应性。研究结果为利用WOFOST模型评估气候变暖对江淮地区水稻生产力的影响提供理论基础和数据支撑。
1 材料与方法
1.1 试验材料
以江淮地区为研究区域,选取安徽合肥,湖北荆州、武汉,江苏兴化、徐州和镇江作为调查点,收集了2006-2012年各站点的逐日气象资料(数据来源:中国气象局
1.2 WOFOST模型水稻生长发育模块的遗传参数
WOFOST模型是一个动态的解释性模型,该模型的模拟基础是作物生理生态过程,主要包括同化作用、呼吸作用、蒸腾作用和干物质的分配等[15,17]。将各站点水稻田间观测资料分为调参组和验证组,且2组数据相互独立。本研究根据当地种植模式,设置模型初始发育期(developmental stage of initial,DVSI)和初始总干物质量(total dry weight of initial,TDWI)模型初始参数(表1),其中出苗期DVSI为0,开花期DVSI为1,成熟期DVSI为2,并采用试错法调试WOFOST模型水稻生长发育参数,包括控制水稻发育期的出苗期—开花期和开花期—成熟期所需积温模型关键参数(TSUM1和TSUM2)(表1)和控制水稻叶面积指数(leaf area index,LAI)、地上部生物量和产量的比叶面积(specific leaf area,SLA)、叶分配系数(fraction of leaf,FL)、茎分配系数(fraction of stem,FS)、穗分配系数(fraction of storage organ,FO)和枯萎速率(reduction factor of senescence,RFSE)模型关键参数(表2)。
表1 江淮地区WOFOST模型水稻发育期模块的遗传参数
Table 1
| 站点 Station | 初始 发育期 DVSI | 初始总干 物质量 TDWI (kg/hm2) | 出苗期— 开花期 所需积温 TSUM1 (℃·d) | 开花期— 成熟期 所需积温 TSUM2 (℃·d) |
|---|---|---|---|---|
| 合肥Hefei | 0.30 | 350 | 1482 | 435 |
| 荆州Jingzhou | 0.23 | 330 | 1345 | 405 |
| 武汉Wuhan | 0.28 | 110 | 1350 | 440 |
| 兴华Xinghua | 0.00 | 310 | 1210 | 455 |
| 徐州Xuzhou | 0.35 | 180 | 1610 | 505 |
| 镇江Zhenjiang | 0.33 | 130 | 1490 | 610 |
表2 江淮地区WOFOST模型水稻生长模块的遗传参数
Table 2
| 站点 Station | 发育阶段 Developmental stage | 比叶面积 SLA (hm2/kg) | 发育阶段 Developmental stage | 叶分配系数 FL (kg/kg) | 茎分配系数 FS (kg/kg) | 穗分配系数 FO (kg/kg) | 发育阶段 Developmental stage | 枯萎速率 RFSE | ||||||||
|---|---|---|---|---|---|---|---|---|---|---|---|---|---|---|---|---|
| 合肥 Hefei | 0.10 | 0.0027 | 0.00 | 0.40 | 0.60 | 0.00 | 0.00 | 0.45 | ||||||||
| 0.70 | 0.0029 | 0.50 | 0.45 | 0.55 | 0.00 | 2.00 | 0.50 | |||||||||
| 0.98 | 0.0020 | 0.71 | 0.58 | 0.42 | 0.60 | |||||||||||
| 1.30 | 0.0029 | 0.95 | 0.10 | 0.30 | 0.80 | |||||||||||
| 1.40 | 0.0010 | 1.00 | 0.00 | 0.20 | 1.00 | |||||||||||
| 2.00 | 0.0010 | 2.00 | 0.00 | 0.00 | 1.00 | |||||||||||
| 荆州 Jingzhou | 0.10 | 0.0017 | 0.00 | 0.40 | 0.60 | 0.00 | 0.00 | 0.30 | ||||||||
| 0.58 | 0.0019 | 0.58 | 0.52 | 0.48 | 0.00 | 2.00 | 0.40 | |||||||||
| 0.86 | 0.0020 | 0.80 | 0.38 | 0.62 | 0.00 | |||||||||||
| 1.10 | 0.0015 | 0.85 | 0.00 | 0.00 | 1.00 | |||||||||||
| 1.40 | 0.0015 | 0.90 | 0.00 | 0.00 | 1.00 | |||||||||||
| 2.00 | 0.0010 | 1.00 | 0.00 | 0.00 | 1.00 | |||||||||||
| 2.00 | 0.00 | 0.00 | 1.00 | |||||||||||||
| 武汉 Wuhan | 0.10 | 0.0025 | 0.00 | 0.55 | 0.46 | 0.00 | 0.00 | 0.50 | ||||||||
| 0.66 | 0.0030 | 0.25 | 0.58 | 0.42 | 0.00 | 2.00 | 0.60 | |||||||||
| 0.90 | 0.0027 | 0.50 | 0.45 | 0.55 | 0.00 | |||||||||||
| 1.30 | 0.0018 | 0.72 | 0.51 | 0.49 | 0.00 | |||||||||||
| 1.40 | 0.0010 | 0.90 | 0.05 | 0.28 | 0.67 | |||||||||||
| 2.00 | 0.0010 | 1.00 | 0.00 | 0.01 | 0.99 | |||||||||||
| 2.00 | 0.00 | 0.00 | 1.00 | |||||||||||||
| 兴华 Xinghua | 0.00 | 0.0020 | 0.00 | 0.40 | 0.60 | 0.00 | 0.00 | 0.60 | ||||||||
| 0.60 | 0.0026 | 0.50 | 0.55 | 0.45 | 0.00 | 2.00 | 0.60 | |||||||||
| 0.90 | 0.0032 | 0.70 | 0.35 | 0.65 | 0.00 | |||||||||||
| 1.00 | 0.0022 | 0.90 | 0.30 | 0.15 | 0.55 | |||||||||||
| 2.00 | 0.0022 | 1.00 | 0.00 | 0.15 | 0.85 | |||||||||||
| 1.10 | 0.00 | 0.00 | 1.00 | |||||||||||||
| 2.00 | 0.00 | 0.00 | 1.00 | |||||||||||||
| 徐州 Xuzhou | 0.10 | 0.0017 | 0.00 | 0.40 | 0.60 | 0.00 | 0.00 | 0.50 | ||||||||
| 0.70 | 0.0019 | 0.50 | 0.45 | 0.55 | 0.00 | 2.00 | 0.40 | |||||||||
| 0.95 | 0.0024 | 0.85 | 0.38 | 0.62 | 0.00 | |||||||||||
| 1.10 | 0.0015 | 0.90 | 0.10 | 0.55 | 0.35 | |||||||||||
| 1.40 | 0.0015 | 1.00 | 0.00 | 0.20 | 0.80 | |||||||||||
| 2.00 | 0.0010 | 2.00 | 0.00 | 0.00 | 1.00 | |||||||||||
| 镇江 Zhenjiang | 0.10 | 0.0017 | 0.00 | 0.40 | 0.60 | 0.00 | 0.00 | 0.30 | ||||||||
| 0.58 | 0.0019 | 0.58 | 0.52 | 0.48 | 0.00 | 2.00 | 0.40 | |||||||||
| 0.86 | 0.0020 | 0.80 | 0.38 | 0.62 | 0.00 | |||||||||||
| 1.10 | 0.0015 | 0.85 | 0.00 | 0.40 | 0.60 | |||||||||||
| 1.40 | 0.0015 | 0.90 | 0.00 | 0.00 | 1.00 | |||||||||||
| 2.00 | 0.0010 | 1.00 | 0.00 | 0.00 | 1.00 | |||||||||||
| 2.00 | 0.00 | 0.00 | 1.00 | |||||||||||||
式中,Xobs为观测值,Xsim为模拟值,
2 结果与分析
2.1 发育期验证
图1
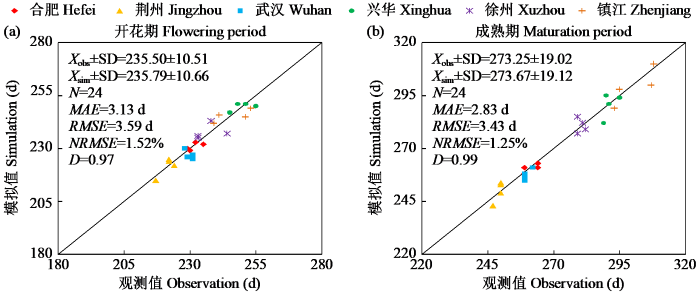
图1
基于WOFOST模型的江淮地区水稻关键发育期验证
Fig.1
Validation of rice key development period in the Jianghuai region based on the WOFOST model
由图1a可知,WOFOST模型模拟江淮地区各站点水稻开花期的观测值与模拟值之间MAE为1.50~4.50 d,RMSE为1.73~4.66 d,NRMSE为0.75%~1.96%,其中荆州水稻开花期最早(221.50 d),兴华水稻开花期最晚(249.75 d),由NRMSE可知,各站点水稻开花期模拟精度大小依次是合肥、荆州、兴华、武汉、徐州、镇江。由图1b可知,WOFOST模型模拟江淮地区各站点水稻成熟期的观测值与模拟值之间MAE为1.75~4.00 d,RMSE为1.94~4.42 d,NRMSE为0.74%~1.49%,其中荆州水稻成熟期最早(249.75 d),镇江水稻成熟期最晚(299.25 d)。由NRMSE可知,各站点水稻成熟期模拟精度大小依次是合肥、武汉、徐州、荆州、镇江、兴华。综上所述,说明WOFOST模型可以很好地模拟江淮地区水稻发育期,其中合肥水稻发育期模拟效果最优。
2.2 生长指标验证
由图2可知,WOFOST模型对江淮地区水稻LAI观测值与模拟值之间的MAE为1.30,RMSE为1.78,NRMSE为31.88%,D值为0.86;对江淮地区水稻器官干物质量观测值与模拟值之间的MAE为(0.72~1.35)×103 kg/hm2,RMSE为(0.92~ 1.78)×103 kg/hm2,NRMSE为13.67%~22.92%,D值为0.85~0.98;对江淮地区水稻产量观测值与模拟值之间的MAE为0.74×103 kg/hm2,RMSE为0.88×103 kg/hm2,NRMSE为9.15%,D值为0.81。
图2
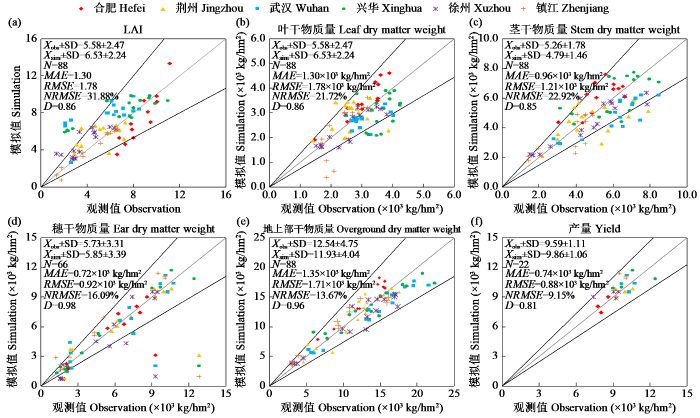
图2
基于WOFOST模型的江淮地区水稻生长过程验证图
Fig.2
Validation of rice growth process in the Jianghuai region based on the WOFOST model
图3
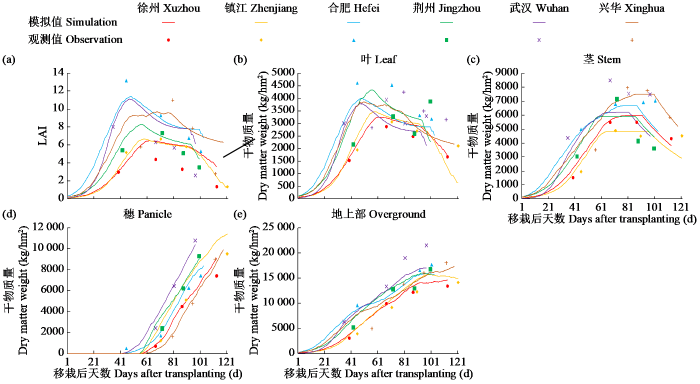
图3
基于WOFOST模型的江淮地区水稻生长指标动态模拟过程
Fig.3
Dynamic simulation process of rice growth indicators in the Jianghuai region based on the WOFOST model
由图2f可知,WOFOST模型对江淮地区各站点水稻产量观测值与模拟值的MAE为(0.43~1.25)×103 kg/hm2,RMSE为(0.45~1.33)×103 kg/hm2,NRMSE为5.49%~13.43%,其中合肥水稻产量最小(8.16×103 kg/hm2),兴华水稻产量最大(10.43×103 kg/hm2)。由NRMSE可知,各站点水稻产量模拟精度大小依次是荆州、合肥、武汉、徐州、兴华、镇江。
综上所述,说明WOFOST模型可以较好地模拟江淮地区水稻生长指标动态变化过程,并具有较高的模拟精度,其中镇江水稻LAI,合肥水稻叶、茎、穗和地上部干物质量,荆州水稻产量模拟效果最优。
3 讨论
4 结论
WOFOST模型可以较好地模拟江淮地区水稻生长发育动态变化过程,开花期、成熟期、LAI、叶干物质量、茎干物质量、穗干物质量、地上干物质量和产量观测值与模拟值的RMSE分别为1.73~4.66 d、1.94~4.42 d、0.39~2.51、(0.43~0.86)× 103 kg/hm2、(0.86~1.52)×103 kg/hm2、(0.52~1.21)× 103 kg/hm2、(1.38~1.96)×103 kg/hm2和(0.45~1.33)×103 kg/hm2;NRMSE分别为0.75%~1.96%、0.74%~1.49%、8.74%~43.40%、14.94%~30.55%、18.16%~28.84%、9.44%~22.81%、11.33%~15.89%和5.49%~13.43%,其中合肥水稻发育期、叶、茎、穗和地上部干物质量,镇江水稻LAI和荆州水稻产量模拟效果最优。水稻LAI、叶和茎干物质量随移栽天数增加呈现先上升后下降的变化趋势,而穗和地上部干物质量随移栽天数增加呈现逐渐上升的趋势。
参考文献
日光温室黄瓜生长发育模拟模型
DOI:10.13287/j.1001-9332.201910.020
[本文引用: 2]

实现日光温室黄瓜生长发育动态模拟预测,可为日光温室黄瓜智慧生产管理提供技术支撑.本研究依据黄瓜生长发育的光温反应特性,以‘津优35’为试验品种,利用2年4茬分期播种试验观测数据建立基于钟模型的温室黄瓜发育模拟模型.依据温室黄瓜叶片生长与关键气象因子(温度和辐射)的关系,以辐热积(TEP)为自变量构建了黄瓜叶面积指数(LAI)模拟模型;依据单位叶面积光合作用对叶面积指数和日长的二重积分,结合黄瓜不同器官的呼吸消耗,构建了黄瓜干重生产分配模拟模型,结合器官含水量,构建了黄瓜器官鲜重模拟模块.基于各子模块构建了温室黄瓜生长发育模拟模型,确定了模型品种参数并进行检验.结果表明: 日光温室黄瓜移栽期-伸蔓期、移栽期-初花期、移栽期-采收初期和移栽期-拉秧期的模拟值与观测值的均方根误差(RMSE)在3.9~10.5 d,归一化均方根标准误差(nRMSE)在6.5%~28.6%,符合度指数(D)在0.79~0.97.LAI与TEP呈S型曲线变化关系,LAI模拟值与实际观测值的RMSE为0.19,nRMSE为17.2%,D值为0.90.根、茎、叶、花和果干重模拟值与实际观测值的RMSE在0.39~8.94 g·m<sup>-2</sup>,nRMSE在10.9%~17.7%,D值均为0.98以上.表明模型能够较准确地模拟黄瓜关键发育期、叶面积和各器官干鲜重,定量化日光温室黄瓜生长发育过程.
Evapotranspiration estimation using a modified crop coefficient model in a rotated rice-winter wheat system
Sensitivity analysis using Morris:Just screening or an effective ranking method?
Comparison of five wheat models simulating phenology under different sowing dates and varieties
Advancing crop modelling capabilities through cultivar-specific parameters sets for the Italian rice germplasm
Multi-metric evaluation of the models WARM, CropSyst, and WOFOST for rice
Comparison of CERES, WOFOST and SWAP models in simulating soil water content during growing season under different soil conditions
Forecasting future crop suitability with microclimate data
Simulation of wheat (Triticum aestivum L.) yield using WOFOST model under different management levels
运用WOFOST模型对浙江水稻潜在生长过程的模拟与验证
通过2001~2003年在金华市和2004年在杭州市的水稻田间试验,应用WOFOST模型对浙江水稻潜在生长进行了模拟和验证。对于常规晚稻秀水11和杂交晚稻协优46,用2001年和2002年的试验数据作参数校正,得到一套参数后,用2003年试验数据作模型验证;对于单季稻两优培九,则以2004年试验数据用于校正,2003年的用于验证。通过对几种水稻品种模拟结果的综合分析,主要结论如下: WOFOST 模型可以成功地用于浙江主要水稻品种潜在生长过程的模拟,可以较好地分析浙江水稻的生长过程和产量潜力。由WOFOST模型计算得到浙江中部地区连作晚稻的生产潜力为8100 kg/hm2左右,中稻为9300 kg/hm2左右。目前两种水稻的实际平均产量分别为模拟产量的78%和70%。判断结果表明,有必要对目前水稻中、后期的田间管理措施进行重新审视。
A growth model based on standardized growing degree days for hydroponic fresh cut tulip in solar greenhouses
不同草地类型WOFOST模型参数敏感性分析
DOI:10.11686/cyxb2021391
[本文引用: 1]
以C为驱动的WOFOST作物生长模型是基于作物生理生态过程,综合考虑了CO<sub>2</sub>、土壤、气候等因素对产量的胁迫作用,因此,对WOFOST模型参数进行本地化和优化便可实现时间连续且高精度的草地生物量监测。为探讨WOFOST参数敏感性分析结果在不同草地类型覆盖区表现出的不确定性问题,在天祝藏族自治县不同草地覆盖区选择了4个站点,利用气象数据、草地实测数据及土壤数据,基于扩展傅里叶幅度敏感性检验法(EFAST)研究潜在水平(指保证营养元素和水分为最佳供应,草地地上生物量仅由辐射、温度和作物特性决定)和水分限制水平(假设营养元素的供给仍然是最佳的, 但需考虑土壤有效水分对蒸发和草地生物量的影响)下WOFOST模型在不同草地类型覆盖区的全局敏感性参数和优化模型模拟精度。结果表明潜在生产水平下草地地上生物量(AGB)的敏感参数有比叶面积(SLATB)、单叶片CO<sub>2</sub>的初始光能利用率(EFFTB)、最大光合速率(AMAXTB)、根相对维持呼吸速率(RMR)、总干物质占根和叶的比例(FRTB和FLTB),水分限制条件下的敏感参数有SLATB、AMAXTB、RMR和FLTB。不同生产水平下叶面积指数(LAI)的敏感参数一致,从出苗到出苗后60 d主要受到SLATB、FLTB和FRTB的影响,出苗后60~200 d的敏感性参数为FLTB、FRTB、SLATB和漫射可见光的消光系数(KDIFTB),LAI开始下降后受到KDIFTB的敏感性增强。其中,山地草甸AGB的模拟值与观测值模拟精度最高,R<sup>2</sup>=0.94、RMSE=11.71 g·m<sup>-2</sup>,高寒草甸模拟精度最低,R<sup>2</sup>=0.83、RMSE=32.68 g·m<sup>-2</sup>。温性荒漠草原LAI的模拟值与观测值模拟精度最高,R<sup>2</sup>=0.96、RMSE=0.02,温性草原模拟精度最低,R<sup>2</sup>=0.66、RMSE=0.38。敏感性分析方法在WOFOST模型中的应用减少了人为主观因素的影响,极大地缩短了调参时间,对获取时间连续的草地生长监测方法选择提供参考。
Manure and mineral fertilizer effects on crop yield and soil carbon sequestration: a meta-analysis and modeling across China
Optimization of water and fertilizer coupling system based on rice grain quality
Diversity analysis of antagonists from rice-associated bacteria and their application in biocontrol of rice diseases
Integrated Bayesian Multi-model approach to quantify input, parameter and conceptual model structure uncertainty in groundwater modeling
