


小豆[Vigna angularis (Willd.) Ohwi & Ohashi]起源于我国,是我国传统药食同源作物,在我国已有2000余年栽培历史[1],现广泛分布于东北、华北和西北等地区[2-3]。小豆富含优质蛋白质(20%~ 25%)及人体必需的8种氨基酸[4],并含有丰富的铁、钙等矿质元素以及萜类和黄酮类等生物活性物质[5-
为了系统评价小豆新品种(系)的农艺性状、生态适应性和产量表现,筛选出适宜不同生态区种植的优良品种,本研究汇集了全国18个试验点27个参试品种(系)的联合鉴定试验数据。试验点涵盖了我国主要小豆种植区域,具有较强的区域代表性。通过对上述试验数据进行了系统分析,旨在评估小豆新品种(系)在不同生态区域的表现差异,遴选出适宜各区域推广的优良品种,为未来小豆育种工作提供理论参考。研究结果将为小豆品种的区域化推广应用提供科学依据,对提高我国小豆产业生产水平和可持续发展具有重要意义。
1 材料与方法
1.1 试验材料
本试验采用27个小豆新品种(系)作为参试材料(表1),材料来源于全国14家育种单位。以冀红352作为对照品种(CK),来源于河北省农林科学院粮油作物研究所。
表1 参试品种(系)及其来源
Table 1
| 编号 Number | 品种(系) Variety (line) | 来源 Origin |
|---|---|---|
| 1 | 龙11-203 | 黑龙江省农业科学院作物育种研究所 |
| 2 | 龙11-805 | 黑龙江省农业科学院作物育种研究所 |
| 3 | H1016 | 吉林省农业科学院 |
| 4 | H1007 | 吉林省农业科学院 |
| 5 | 182-320 | 黑龙江省农业科学院齐齐哈尔分院 |
| 6 | 195-609 | 黑龙江省农业科学院齐齐哈尔分院 |
| 7 | 辽红08704-05 | 辽宁省农业科学院 |
| 8 | 辽红08706-12 | 辽宁省农业科学院 |
| 9 | 赤红3号 | 内蒙古赤峰市农牧科学研究院 |
| 10 | 品红2020-21-12-8-11 | 中国农业科学院作物科学研究所 |
| 11 | 品红2020-4-7-2 | 中国农业科学院作物科学研究所 |
| 12 | 品红2019-3-3-1 | 中国农业科学院作物科学研究所 |
| 13 | 品红2019-22-14-12 | 中国农业科学院作物科学研究所 |
| 14 | 冀红0921反-4-1-3-3-4 | 河北省农林科学院粮油作物研究所 |
| 15 | 冀红1105反-5-4-1-2 | 河北省农林科学院粮油作物研究所 |
| 16 | 保红201432-8 | 保定市农业科学院 |
| 17 | 保红201429-8 | 保定市农业科学院 |
| 18 | 唐红201301-2 | 唐山市农业科学院 |
| 19 | 唐红201509-12 | 唐山市农业科学院 |
| 20 | 同红6号 | 山西省农业科学院高寒区作物研究所 |
| 21 | 同红7号 | 山西省农业科学院高寒区作物研究所 |
| 22 | 苏红17-606 | 江苏省农业科学院 |
| 23 | 陇红3号 | 庆阳市农业科学院 |
| 24 | 贵红2号 | 毕节市农业科学研究所 |
| 25 | 贵红3号 | 毕节市农业科学研究所 |
| 26 | 桂红20-9-1 | 广西省农业科学院水稻研究所 |
| 27 | 桂红20-21-1 | 广西省农业科学院水稻研究所 |
1.2 试验设计
多点联合鉴定试验于2022-2023年在北京、黑龙江齐齐哈尔和江苏南京等18个试验点进行。根据各试验点地理位置和气候条件的差异,将18个试验点划分为3个生态区(表2)。试验地选择地势平坦、茬口一致、肥力中等偏上且具备灌溉条件的地块。不同生态区域播种期有所差异,北方春播区播期为5月10-25日,北方夏播区为6月15-25日,南方区则根据前茬作物收获时间确定播期。试验采用随机区组设计,设3次重复。小区面积10 m2(种植4行,行长5.0 m,行距0.5 m),播深3~4 cm,播深力求一致、均匀,覆土后进行镇压。成熟期按小区进行收获、脱粒和晾晒。
表2 18个试验点播种期
Table 2
| 编号 Number | 试验点 Test site | 播种期Sowing period | |
|---|---|---|---|
| 2022 | 2023 | ||
| 北方春播区Northern Spring Sowing Area | |||
| E1 | 黑龙江哈尔滨 | 05-15 | 05-16 |
| E2 | 黑龙江齐齐哈尔 | 05-18 | 05-18 |
| E3 | 吉林长春 | 05-28 | 05-22 |
| E4 | 辽宁沈阳 | 06-11 | 05-25 |
| E5 | 内蒙古呼和浩特 | 05-10 | 05-15 |
| E6 | 内蒙古赤峰 | 05-25 | 05-12 |
| E7 | 山西太原 | 05-22 | 06-06 |
| E8 | 山西大同 | 05-19 | 05-21 |
| E9 | 河北张家口 | 05-14 | 05-16 |
| E10 | 陕西榆林 | 05-11 | 05-17 |
| 北方夏播区Northern Summer Sowing Area | |||
| E11 | 河北保定 | 06-26 | 06-21 |
| E12 | 河北石家庄 | 06-23 | 06-25 |
| E13 | 河北唐山 | 06-24 | 06-24 |
| E14 | 北京 | 06-18 | 06-18 |
| 南方区South Region | |||
| E15 | 江苏南京 | 06-22 | 07-25 |
| E16 | 贵州毕节 | 04-26 | 05-06 |
| E17 | 重庆 | 06-14 | 05-15 |
| E18 | 广西南宁 | 07-08 | 07-29 |
1.3 测定项目与方法
于小豆生长季,定期观测并记录主要农艺性状,包括生育期(从播种至成熟的天数)、株高(从地面至主茎顶端的高度)和主茎分枝数等。收获后,测定单株荚数、百粒重和单荚粒数等产量相关指标。于成熟期每小区随机选取5株测定株高和主茎节数,取平均值;荚长为每小区随机选取5个豆荚测定平均长度,所有农艺性状的测定均参照《小豆种质资源描述规范与数据标准》[19]执行。采用小区实收法测定产量。成熟后,按小区收获、脱粒、晾晒至水分含量12%~14%后,折算为单位面积产量。
1.4 数据处理
采用方差分析(ANOVA)评估不同试验点和生态区小豆新品种(系)的农艺性状与产量表现的差异显著性,基于R统计分析软件(v4.3.1)进行数据分析。采用Eberhart和Russell联合回归模型[20]评估品种稳定性,该方法基于线性模型分析品种产量对环境变化的响应,即产量Yij是环境效应Ij的线性函数,具体公式如下:Yij = μi+βiIj+δij,式中,Yij是第i个品种在第j个环境中的产量;μi是第i个品种的平均产量;βi是第i个品种的回归系数,表示该品种对环境变化的响应程度;Ij是第j个环境的平均效应;δij是回归残差,表示未解释的随机变异。
2 结果与分析
2.1 不同试点间小豆新品种(系)农艺性状变异
方差分析表明,小豆新品种(系)农艺性状在全国18个试验点间存在明显的区域异质性(表3),其中主茎分枝数、株高及单株荚数受环境互作效应较强,变异系数较大。主茎节数次之,单荚粒数、百粒重、荚长及生育期变异系数相对较小。各试验点间,生育期的平均值变幅为71.9~121.1 d;平均株高在黑龙江哈尔滨最高,在广西南宁最低;主茎节数均值变幅为7.2~19.9;单株荚数最多的为南宁,最少的为齐齐哈尔;单荚粒数平均值变幅为5.1~10.7;百粒重均值变幅为9.1~16.7 g。以上结果表明各性状受环境影响程度各异,主茎分枝数、株高和单株荚数等性状受环境影响较大。
表3 不同试点间小豆新品种(系)的主要农艺性状变异分析
Table 3
| 编号 Number | 参数 Parameter | 生育期 Growth period (d) | 株高 Plant height (cm) | 主茎节数 Number of main stem nodes | 主茎分枝数 Number of main stem branches | 单株荚数 Number of pods per plant | 荚长 Pod length (cm) | 单荚粒数 Number of grains per pod | 百粒重 100-grain weight (g) |
|---|---|---|---|---|---|---|---|---|---|
| E1 | 最小值 | 111.5 | 61.0 | 14.5 | 1.4 | 15.6 | 7.8 | 6.2 | 10.9 |
| 最大值 | 127.0 | 155.3 | 19.6 | 3.1 | 37.7 | 10.1 | 8.1 | 17.8 | |
| 平均值 | 121.1 | 114.2 | 16.9 | 2.2 | 24.6 | 8.9 | 7.3 | 14.1 | |
| E2 | 最小值 | 99.5 | 29.5 | 12.6 | 0.6 | 8.5 | 7.6 | 5.2 | 7.8 |
| 最大值 | 124.5 | 80.8 | 16.4 | 2.7 | 20.7 | 10.0 | 8.2 | 19.6 | |
| 平均值 | 117.8 | 59.7 | 14.3 | 1.6 | 13.8 | 8.8 | 6.7 | 13.9 | |
| E3 | 最小值 | 101.5 | 33.7 | 11.5 | 1.0 | 2.0 | 5.9 | 7.6 | 8.3 |
| 最大值 | 112.5 | 79.9 | 20.9 | 3.0 | 28.0 | 9.0 | 10.1 | 19.2 | |
| 平均值 | 107.0 | 56.2 | 15.6 | 2.2 | 15.4 | 7.6 | 9.1 | 12.7 | |
| E4 | 最小值 | 81.5 | 53.5 | 16.2 | 2.7 | 20.4 | 7.7 | 5.8 | 9.9 |
| 最大值 | 100.0 | 110.9 | 22.6 | 5.0 | 55.7 | 10.3 | 8.7 | 19.0 | |
| 平均值 | 93.0 | 69.8 | 19.0 | 4.0 | 36.1 | 9.1 | 7.7 | 13.5 | |
| E5 | 最小值 | 115.0 | 46.1 | 11.1 | 5.5 | 27.2 | 7.9 | 5.6 | 9.7 |
| 最大值 | 122.0 | 93.8 | 15.6 | 8.3 | 48.3 | 11.4 | 8.7 | 19.5 | |
| 平均值 | 118.2 | 71.6 | 13.2 | 7.2 | 36.2 | 9.1 | 7.1 | 15.0 | |
| E6 | 最小值 | 105.0 | 55.5 | 14.0 | 2.0 | 12.0 | 9.9 | 9.0 | 12.2 |
| 最大值 | 128.5 | 142.7 | 20.0 | 4.7 | 44.3 | 13.7 | 12.3 | 20.3 | |
| 平均值 | 115.0 | 84.9 | 16.5 | 3.7 | 32.5 | 12.1 | 10.7 | 15.5 | |
| E7 | 最小值 | 97.5 | 35.5 | 12.7 | 1.8 | 4.9 | 7.9 | 6.0 | 9.4 |
| 最大值 | 124.0 | 85.9 | 18.4 | 4.9 | 38.7 | 12.3 | 8.6 | 23.1 | |
| 平均值 | 107.8 | 52.8 | 15.3 | 2.9 | 19.5 | 9.0 | 7.1 | 16.7 | |
| E8 | 最小值 | 98.0 | 31.7 | 9.2 | 1.9 | 2.1 | 8.0 | 6.2 | 8.2 |
| 最大值 | 110.0 | 101.7 | 17.0 | 6.1 | 65.0 | 10.0 | 8.8 | 18.4 | |
| 平均值 | 103.9 | 60.2 | 12.9 | 3.6 | 37.8 | 9.1 | 7.6 | 13.5 | |
| E9 | 最小值 | 93.0 | 40.6 | 11.9 | 1.2 | 7.0 | 7.8 | 5.5 | 8.5 |
| 最大值 | 124.0 | 111.0 | 19.1 | 3.8 | 34.2 | 9.5 | 8.5 | 19.8 | |
| 平均值 | 106.2 | 71.4 | 15.4 | 2.1 | 24.1 | 8.6 | 7.1 | 13.6 | |
| E10 | 最小值 | 88.0 | 12.9 | 3.2 | 2.0 | 10.6 | 5.9 | 5.5 | 5.2 |
| 最大值 | 122.0 | 68.2 | 11.6 | 7.5 | 43.5 | 8.6 | 8.9 | 17.5 | |
| 平均值 | 102.7 | 35.1 | 7.0 | 3.2 | 27.6 | 7.8 | 7.3 | 11.8 | |
| E11 | 最小值 | 87.0 | 28.7 | 12.6 | 1.7 | 12.4 | 6.7 | 6.1 | 7.4 |
| 最大值 | 102.0 | 81.3 | 20.3 | 4.1 | 39.2 | 9.2 | 8.8 | 18.3 | |
| 平均值 | 94.6 | 56.2 | 17.2 | 2.7 | 28.0 | 8.2 | 7.0 | 12.6 | |
| E12 | 最小值 | 80.0 | 28.3 | 13.8 | 1.1 | 17.3 | 6.7 | 5.3 | 6.7 |
| 最大值 | 104.0 | 103.3 | 23.6 | 5.4 | 62.6 | 8.7 | 8.7 | 16.1 | |
| 平均值 | 88.1 | 49.6 | 18.6 | 2.8 | 38.7 | 8.0 | 6.6 | 12.1 | |
| E13 | 最小值 | 82.0 | 43.2 | 15.5 | 1.6 | 18.8 | 6.5 | 6.1 | 6.0 |
| 最大值 | 98.5 | 84.9 | 23.7 | 4.9 | 38.8 | 9.0 | 8.8 | 18.5 | |
| 平均值 | 89.2 | 62.1 | 19.9 | 3.2 | 26.2 | 7.7 | 7.2 | 13.2 | |
| E14 | 最小值 | 95.0 | 28.7 | 11.7 | 1.3 | 16.7 | 5.7 | 4.7 | 7.4 |
| 最大值 | 125.0 | 87.0 | 20.7 | 7.0 | 61.3 | 8.9 | 9.0 | 21.0 | |
| 平均值 | 108.0 | 55.4 | 16.5 | 3.5 | 35.4 | 7.4 | 6.4 | 13.5 | |
| E15 | 最小值 | 84.5 | 31.4 | 12.7 | 2.7 | 16.5 | 6.3 | 6.0 | 6.5 |
| 最大值 | 95.5 | 61.8 | 17.0 | 5.5 | 46.9 | 8.4 | 8.8 | 17.2 | |
| 平均值 | 90.9 | 43.6 | 14.3 | 4.0 | 26.2 | 7.6 | 7.3 | 11.7 | |
| E16 | 最小值 | 104.5 | 28.7 | 6.9 | 0.9 | 12.0 | 6.8 | 3.9 | 8.8 |
| 最大值 | 114.5 | 58.0 | 13.0 | 4.0 | 33.3 | 9.7 | 6.5 | 19.5 | |
| 平均值 | 109.2 | 36.6 | 8.8 | 2.1 | 20.1 | 8.1 | 5.1 | 13.4 | |
| E17 | 最小值 | 102.0 | 29.3 | 10.1 | 0.3 | 8.5 | 5.9 | 4.4 | 9.5 |
| 最大值 | 126.5 | 57.2 | 19.8 | 4.3 | 29.6 | 9.7 | 8.2 | 24.9 | |
| 平均值 | 117.4 | 42.9 | 14.8 | 2.0 | 16.2 | 7.9 | 6.4 | 16.7 | |
| E18 | 最小值 | 69.0 | 15.1 | 11.0 | 0.1 | 17.4 | 6.4 | 5.7 | 4.8 |
| 最大值 | 75.0 | 43.9 | 20.7 | 1.8 | 65.7 | 9.4 | 10.8 | 12.7 | |
| 平均值 | 71.9 | 31.7 | 16.0 | 1.0 | 42.7 | 7.7 | 7.7 | 9.1 | |
| 变异系数Cofficient variation (%) | 12.3 | 32.8 | 20.9 | 43.2 | 30.5 | 12.3 | 15.2 | 13.2 |
2.2 不同生态区间小豆新品种(系)的性状变异
不同生态区间小豆新品种(系)各性状差异显著(图1)。北方春播区平均生育期最长,极显著高于北方夏播区和南方区;株高亦为北方春播区最高,北方夏播区次之,南方区最低;北方夏播区主茎节数最多,北方春播区次之,南方区最少;主茎分枝数南方区最低,极显著低于北方春播区和北方夏播区,北方春播区和北方夏播区无显著差异;单株荚数北方夏播区最高,极显著高于北方春播区和南方区;荚长和单荚粒数均为北方春播区极显著高于其余2个区,北方夏播区和南方区无显著差异;百粒重在3个生态区间无显著差异。上述性状差异可能与生态区气候条件及土壤肥力相关。生态区间气候、土壤及水分条件的差异显著影响小豆生长、发育与产量。随纬度递增,小豆生育期、株高、主茎分枝数和单株荚数等性状呈增大趋势,而百粒重受环境因素影响较小。
图1
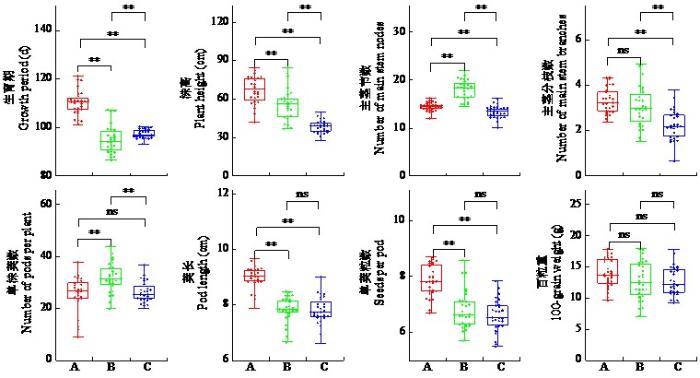
图1
不同生态区间小豆新品种(系)的性状差异
A:北方春播区,B:北方夏播区,C:南方区。“*”表示在P < 0.05水平上差异显著,“**”表示在P < 0.01水平上差异极显著,ns表示无显著差异。下同。
Fig.1
Trait differences of new adzuki bean varieties (lines) across different ecological regions
A: Northern Spring Sowing Area, B: Northern Summer Sowing Area, C: Southern Area.“*”indicates significant difference at P < 0.05 level,“**”indicates extremely significant difference at P < 0.01 level, ns indicates no significant difference. The same below.
2.3 不同小豆新品种(系)产量分析
18个试验点产量结果(表4)显示,保红201429-8、赤红3号、唐红201301-2、195-609、品红2019-3-3-1、辽红08704-05、品红2020-4-7-2、同红7号和唐红201509-12平均产量高于CK,增产0.29%~8.79%。保红201429-8平均产量最高,达1690.29 kg/hm2,赤红3号和唐红201301-2次之,分别为1660.52和1652.24 kg/hm2。
表4 不同小豆品种(系)间的产量差异
Table 4
| 编号 Number | 品种(系) Variety (line) | 平均产量 Average yield (kg/hm2) | 较CK增产率 Yield increase over CK (%) |
|---|---|---|---|
| 1 | 龙11-203 | 1478.87 | -4.82 |
| 2 | 龙11-805 | 1352.27 | -12.97 |
| 3 | H1016 | 1253.93 | -19.30 |
| 4 | H1007 | 1372.48 | -11.67 |
| 5 | 182-320 | 1521.19 | -2.09 |
| 6 | 195-609 | 1649.30 | 6.15 |
| 7 | 辽红08704-05 | 1597.64 | 2.83 |
| 8 | 辽红08706-12 | 1549.87 | -0.25 |
| 9 | 赤红3号 | 1660.52 | 6.87 |
| 10 | 品红2020-21-12-8-11 | 1453.06 | -6.48 |
| 11 | 品红2020-4-7-2 | 1596.75 | 2.77 |
| 12 | 品红2019-3-3-1 | 1599.56 | 2.95 |
| 13 | 品红2019-22-14-12 | 1349.26 | -13.16 |
| 14 | 冀红0921反-4-1-3-3-4 | 1521.31 | -2.09 |
| 15 | 冀红1105反-5-4-1-2 | 1552.94 | -0.05 |
| 16 | 保红201432-8 | 991.59 | -36.18 |
| 17 | 保红201429-8 | 1690.29 | 8.79 |
| 18 | 唐红201301-2 | 1652.24 | 6.34 |
| 19 | 唐红201509-12 | 1558.29 | 0.29 |
| 20 | 同红6号 | 1440.00 | -7.32 |
| 21 | 同红7号 | 1560.45 | 0.43 |
| 22 | 苏红17-606 | 1458.98 | -6.10 |
| 23 | 陇红3号 | 726.35 | -53.25 |
| 24 | 贵红2号 | 815.07 | -47.54 |
| 25 | 贵红3号 | 804.88 | -48.20 |
| 26 | 桂红20-9-1 | 811.19 | -47.79 |
| 27 | 桂红20-21-1 | 1279.59 | -17.64 |
| 28 | 冀红352 | 1553.74 | - |
图2
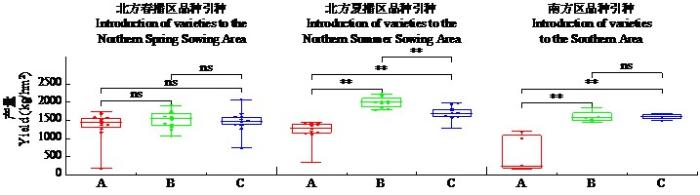
图2
不同来源小豆新品种(系)在不同生态区的产量表现
Fig.2
Yield performance of new adzuki bean varieties (lines) from different sources across various ecological regions
2.4 不同小豆新品种(系)品种稳定性和适应性分析
高产与稳产是品种推广的基本要求。为了进一步评估小豆新品种(系)的稳定性和适应性,本研究采用了Eberhart和Russell的稳定性分析方法。结果(表5)显示,保红201429-8和唐红201509-12产量高于冀红352,且环境回归系数接近于1,回归残差小,表明其对环境变化的响应稳定,适宜多点种植,具有高产广适特性。其中,保红201429-8在北方春播区和南方区表现突出,唐红201509-12则在北方夏播区表现最佳。赤红3号、195-609、辽红08704-05和同红7号在18个试验点的平均产量虽高于CK,但稳产性欠佳,适宜在北方春播区种植。唐红201301-2、品红2019-3-3-1和品红2020-4-7-2适宜在北方春播区和北方夏播区种植。苏红17-606产量变异系数低,稳产性良好,但产量低于CK。
表5 不同小豆新品种(系)的产量稳定性分析
Table 5
| 编号 Number | 品种(系) Variety (line) | 产量 Yield (kg/hm2) | 回归系数 βi | 回归残差 δi2 | 适应地区 Adaptation region |
|---|---|---|---|---|---|
| 1 | 龙11-203 | 1478.87 | 1.05 | 0.22 | E1,E2,E3,E4,E9,E14,E16,E17,E18 |
| 2 | 龙11-805 | 1352.27 | 0.98 | 0.18 | E1,E2,E4,E6,E7,E9,E15 |
| 3 | H1016 | 1253.93 | 0.92 | 0.20 | E3,E4,E5,E6,E8,E9,E10,E13,E16 |
| 4 | H1007 | 1372.48 | 1.10 | 0.25 | E1,E2,E3,E4,E5,E6,E7,E8,E9,E10,E16 |
| 5 | 182-320 | 1521.19 | 1.02 | 0.15 | E1,E2,E3,E4,E5,E6 |
| 6 | 195-609 | 1649.30 | 1.08 | 0.25 | E1,E2,E4,E5,E6 |
| 7 | 辽红08704-05 | 1597.64 | 1.00 | 0.20 | E1,E2,E3,E4,E5,E6,E9,E10 |
| 8 | 辽红08706-12 | 1549.87 | 0.95 | 0.18 | E1,E2,E3,E4,E5,E6,E9 |
| 9 | 赤红3号 | 1660.52 | 1.12 | 0.22 | E1,E2,E4,E5,E6,E7,E8,E9 |
| 10 | 品红2020-21-12-8-11 | 1453.06 | 0.97 | 0.20 | E2,E5,E7,E10,E11,E12,E14,E15 |
| 11 | 品红2020-4-7-2 | 1596.75 | 1.03 | 0.22 | E5,E6,E11,E12,E14,E17 |
| 12 | 品红2019-3-3-1 | 1599.56 | 1.02 | 0.19 | E2,E4,E5,E6,E10,E11,E14 |
| 13 | 品红2019-22-14-12 | 1349.26 | 0.95 | 0.25 | E5,E6,E7,E8,E10,E11,E13,E14,E15 |
| 14 | 冀红0921反-4-1-3-3-4 | 1521.31 | 1.04 | 0.23 | E5,E10,E11,E12,E14,E17 |
| 15 | 冀红1105反-5-4-1-2 | 1552.94 | 1.07 | 0.21 | E5,E8,E11,E12,E13,E14,E16,E17,E18 |
| 16 | 保红201432-8 | 991.59 | 0.88 | 0.30 | E11,E12,E13,E14,E15,E16,E18 |
| 17 | 保红201429-8 | 1690.29 | 1.15 | 0.18 | E1~E18 |
| 18 | 唐红201301-2 | 1652.24 | 1.09 | 0.17 | E5,E7,E11,E12,E13,E14 |
| 19 | 唐红201509-12 | 1558.29 | 1.05 | 0.19 | E1~E18 |
| 20 | 同红6号 | 1440.00 | 0.96 | 0.22 | E5,E8,E10,E11,E12,E13 |
| 21 | 同红7号 | 1560.45 | 1.08 | 0.18 | E1,E2,E4,E5,E7,E8,E9 |
| 22 | 苏红17-606 | 1458.98 | 0.99 | 0.20 | E1~E18 |
| 23 | 陇红3号 | 726.35 | 0.75 | 0.35 | E7,E12,E13,E15,E16,E18 |
| 24 | 贵红2号 | 815.07 | 0.82 | 0.30 | E11,E12,E13,E14,E15,E16,E18 |
| 25 | 贵红3号 | 804.88 | 0.80 | 0.32 | E7,E11,E12,E13,E14,E15,E16,E18 |
| 26 | 桂红20-9-1 | 811.19 | 0.85 | 0.28 | E7,E11,E12,E13,E15,E16,E17,E18 |
| 27 | 桂红20-21-1 | 1279.59 | 0.95 | 0.25 | E2,E5,E7,E9,E11,E16,E17,E18 |
| 28 | 冀红352 | 1553.74 | 1.00 | 0.20 | E4,E5,E6,E10,E11,E12,E14 |
2.5 不同区域适宜品种(系)的筛选
综合不同生态区间及试验点产量表现(表6),筛选出适宜各区域种植的优良品种(系)。结果表明,赤红3号、195-609和辽红08704-05等适宜北方春播区;唐红201301-2、品红2020-4-7-2、品红2019-3-3-1和冀红1105反-5-4-1-2等适宜北方夏播区;保红201429-8、冀红1105反-5-4-1-2和龙11-203等适宜南方区。此外,鉴于产量性状易受环境影响,建议各试验点因地制宜选择品种(系)。
表6 各生态区及试验点产量排名前3位的小豆品种(系)
Table 6
| 生态区Ecological zone | 编号Number | 适宜的品种(系)Suitable variety (line) |
|---|---|---|
| 北方春播区Northern Spring Sowing Area | E1 | 195-609*,辽红08706-12,182-320 |
| E2 | 195-609*,辽红08706-12,同红7号 | |
| E3 | 182-320,H1007,辽红08704-05* | |
| E4 | 195-609*,赤红3号*,龙11-805 | |
| E5 | 赤红3号*,唐红201301-2,品红2020-4-7-2 | |
| E6 | 195-609*,辽红08706-12,赤红3号* | |
| E7 | 赤红3号*,同红7号,品红2020-4-7-2 | |
| E8 | 同红6号,H1016(吉红15号),同红7号 | |
| E9 | 辽红08704-05*,赤红3号*,龙11-203 | |
| E10 | 同红6号,冀红0921反-4-1-3-3-4,品红2019-22-14-12 | |
| 北方夏播区Northern Summer Sowing Area | E11 | 唐红201301-2*,品红2020-21-12-8-11,冀红1105反-5-4-1-2* |
| E12 | 冀红0921反-4-1-3-3-4,冀红1105反-5-4-1-2*,品红2020-21-12-8-11 | |
| E13 | 冀红1105反-5-4-1-2*,唐红201301-2*,唐红201509-12 | |
| E14 | 品红2020-4-7-2*,品红2019-3-3-1,唐红201301-2* | |
| 南方区South Region | E15 | 品红2020-21-12-8-11,品红2020-4-7-2,苏红17-606 |
| E16 | 龙11-203*,陇红3号,贵红2号 | |
| E17 | 冀红0921反-4-1-3-3-4,保红201429-8*,冀红1105反-5-4-1-2* | |
| E18 | 龙11-203*,陇红3号,贵红3号 |
“*”表示每个生态区产量排名前3位的小豆品种(系)。
“*”indicates the top three high-yielding adzuki bean varieties (lines) in each ecological zone.
3 讨论
3.1 不同生态环境对小豆新品种(系)农艺性状的影响
3.2 不同生态环境下小豆新品种(系)的产量差异
品种鉴定易受多种因素影响。本研究通过多点试验和综合分析,筛选出了9个产量优势小豆新品种(系),较对照冀红352平均增产0.29%~8.79%。其中,保红201429-8、赤红3号和唐红201301-2产量位列前三。研究[29-
鉴于小豆产量易受环境影响,未来宜扩大试验区域,如增加西北旱作区和东南沿海试验点,并增加试验年份、统一科学管理等,以全面评估新品种(系)的适应性。小豆育种目标亦应多元化,在追求丰产和稳产的基础上,顺应产业发展及市场需求,注重提高小豆品质、抗逆性及商品性,培育早熟、大粒、耐逆、抗病、结荚集中和宜机械化收获等优良性状的小豆品种。此外,未来研究应加强小豆分子标记辅助育种研究,探索抗病性和品质改良的分子机制,尤其针对小豆疫霉病、锈病、花叶病毒病和根腐病等主要病害,利用全基因组关联分析(GWAS)技术定位抗性基因,开发分子标记辅助抗病育种。并借助基因编辑和全基因组选择等现代育种技术,加速优良性状聚合与品种进程,全面提升小豆品种综合性状。
4 结论
基于2年全国多环境联合鉴定,本研究系统解析了27个小豆新品种(系)的多环境变异,筛选出高产广适性品种保红201429-8和唐红201509- 12。同时明确适宜北方春播区(赤红3号等)、北方夏播区(唐红201301-2等)、南方区(冀红1105反-5-4-1-2等)种植的优良品种(系)。
参考文献
中国食用豆产业和种业发展现状与未来展望
DOI:10.3864/j.issn.0578-1752.2021.03.004
[本文引用: 1]

食用豆在中国粮食组成、人类健康、土壤改良中占有重要地位,尤其是在贫困地区作为蛋白质的主要来源。随着食用豆基因组相继被破译,推动了食用豆分子遗传基础和分子育种研究。国家食用豆产业技术体系成立以来,育成了一批高产、优质、抗病虫、耐逆、适宜机械化收获的食用豆新品种,集成了一批适合不同产区的栽培技术,病虫害绿色防控技术的研发与应用取得了良好的防治效果,生产机械与技术研究初显成效,产后加工技术提升与产品创新研究促进产业提质增效。随着食用豆新品种新技术的示范与推广,食用豆总产和单产水平显著提高,特别是在过去十年内蚕豆、豌豆由干籽粒生产转变为鲜食菜用生产,食用豆种植面积提高了21.1%,单产提高了3.9%,总产提高了36.8%。随着食用豆产业规模不断扩大,越来越多的食用豆种被列为国家农产品地理标志产品,正在形成一批农业企业品牌。在食用豆产业的带动下,品种权保护与转让数量逐渐增多,食用豆种业开始起步发展。随着人们健康意识的提高,国内外市场需求快速上升,国家乡村振兴战略的实施和农业供给侧结构性改革的推进,大力培育壮大贫困地区特色优势产业,给食用豆生产和种业带来了新的机遇;但是中国食用豆生产和种业也面临生产成本较高、生产效率低、科研平台建设有待加强、缺乏突破性大品种、品种权保护力度不够等诸多挑战。本文在总结中国食用豆产业和种业的现状与问题的基础上,讨论了其未来的发展方向。
High-resolution genomic resources for trait mapping and precision breeding for adzuki bean (Vigna angularis)
DOI:10.1002/advs.v13.4 URL [本文引用: 1]
Development of SSR markers and assessment of genetic diversity of adzuki bean in the Chinese germplasm collection
DOI:10.1007/s11032-015-0202-z URL [本文引用: 1]
Nutritional potential of adzuki bean germplasm and mining nutri-dense accessions through multivariate analysis
DOI:10.3390/foods12224159 URL [本文引用: 1]
Nutritional composition, efficacy, and processing of Vigna angularis (adzuki bean) for the human diet: an overview
DOI:10.3390/molecules27186079 URL
Nutrient transfer and antioxidant effect of adzuki bean before and after GABA enrichment
DOI:10.3389/fnut.2023.1123075 URL [本文引用: 1]
Cholesterol-lowering activity of adzuki bean (Vigna angularis) polyphenols
DOI:10.1007/s11033-023-08481-7
PMID:37160631
[本文引用: 1]
Adzuki beans (ABs; Vigna angularis) were reported to show potential for prevention of cholesterol absorption and lowering of the blood cholesterol level. However, the main active compounds and some cellular effects remain unknown. In this study, we evaluated the potential cholesterol-lowering effects of (+)-catechin 7-O-β-D-glucopyranoside (C7G) and (+)-epicatechin 7-O-β-D-glucopyranoside (E7G), identified as abundant polyphenols in ABs.To investigate the cholesterol-lowering activity in vitro, cholesterol micelles, bile acids, and Caco-2 cells as an intestinal model were used in the study. C7G and E7G each inhibited micellar solubility in a dose-dependent manner, and their inhibitory activity was as strong as that of (+)-catechin (IC values: C7G, 0.23 ± 0.03 mg/ml; E7G, 0.22 ± 0.02 mg/ml; (+)-catechin, 0.26 ± 0.11 mg/ml). The AB polyphenols showed binding activity toward bile acids and changed them into an insoluble form. When Caco-2 cells were treated with C7G or E7G, the amount of incorporated cholesterol was significantly decreased compared with vehicle-treated control cells, and no cytotoxicity was observed under the experimental conditions used. Meanwhile, quantitative real-time PCR revealed that the mRNA level of the cholesterol transporter NPC1L1 remained unchanged in the treated cells.Taken together, the present findings suggest that C7G and E7G are the main active compounds in ABs, and have the ability to inhibit micellar solubility, bind to bile acids, and suppress cholesterol absorption. The present study supports the health benefits of ABs as a medicinal food and the application of AB polyphenols as medicinal supplements to suppress cholesterol elevation.© 2023. The Author(s), under exclusive licence to Springer Nature B.V.
Multi-trait multi-environment genomic prediction of agronomic traits in advanced breeding lines of winter wheat
DOI:10.3389/fpls.2021.709545 URL [本文引用: 1]
Genotype x environment interactions for grain yield in rainfed winter wheat multi-environment trials in Iran
DOI:10.2134/agronj2010.0062 URL [本文引用: 2]
Multi-environment genomic selection in rice elite breeding lines
DOI:10.1186/s12284-023-00623-6
PMID:36752880
[本文引用: 2]
Assessing the performance of elite lines in target environments is essential for breeding programs to select the most relevant genotypes. One of the main complexities in this task resides in accounting for the genotype by environment interactions. Genomic prediction models that integrate information from multi-environment trials and environmental covariates can be efficient tools in this context. The objective of this study was to assess the predictive ability of different genomic prediction models to optimize the use of multi-environment information. We used 111 elite breeding lines representing the diversity of the international rice research institute breeding program for irrigated ecosystems. The lines were evaluated for three traits (days to flowering, plant height, and grain yield) in 15 environments in Asia and Africa and genotyped with 882 SNP markers. We evaluated the efficiency of genomic prediction to predict untested environments using seven multi-environment models and three cross-validation scenarios.The elite lines were found to belong to the indica group and more specifically the indica-1B subgroup which gathered improved material originating from the Green Revolution. Phenotypic correlations between environments were high for days to flowering and plant height (33% and 54% of pairwise correlation greater than 0.5) but low for grain yield (lower than 0.2 in most cases). Clustering analyses based on environmental covariates separated Asia's and Africa's environments into different clusters or subclusters. The predictive abilities ranged from 0.06 to 0.79 for days to flowering, 0.25-0.88 for plant height, and - 0.29-0.62 for grain yield. We found that models integrating genotype-by-environment interaction effects did not perform significantly better than models integrating only main effects (genotypes and environment or environmental covariates). The different cross-validation scenarios showed that, in most cases, the use of all available environments gave better results than a subset.Multi-environment genomic prediction models with main effects were sufficient for accurate phenotypic prediction of elite lines in targeted environments. These results will help refine the testing strategy to update the genomic prediction models to improve predictive ability.© 2023. The Author(s).
Genotype by environment interaction analysis in summer maize hybrids for grain yield under multi-environment trials in Huang-Huai-Hai Area, China
Stability parameters for comparing varieties
DOI:10.2135/cropsci1966.0011183X000600010011x URL [本文引用: 1]
Genomic prediction from multi-environment trials of wheat breeding
DOI:10.3390/genes15040417
URL
[本文引用: 1]
Genomic prediction relates a set of markers to variability in observed phenotypes of cultivars and allows for the prediction of phenotypes or breeding values of genotypes on unobserved individuals. Most genomic prediction approaches predict breeding values based solely on additive effects. However, the economic value of wheat lines is not only influenced by their additive component but also encompasses a non-additive part (e.g., additive × additive epistasis interaction). In this study, genomic prediction models were implemented in three target populations of environments (TPE) in South Asia. Four models that incorporate genotype × environment interaction (G × E) and genotype × genotype (GG) were tested: Factor Analytic (FA), FA with genomic relationship matrix (FA + G), FA with epistatic relationship matrix (FA + GG), and FA with both genomic and epistatic relationship matrices (FA + G + GG). Results show that the FA + G and FA + G + GG models displayed the best and a similar performance across all tests, leading us to infer that the FA + G model effectively captures certain epistatic effects. The wheat lines tested in sites in different TPE were predicted with different precisions depending on the cross-validation employed. In general, the best prediction accuracy was obtained when some lines were observed in some sites of particular TPEs and the worse genomic prediction was observed when wheat lines were never observed in any site of one TPE.
Multi-environment evaluation of rice genotypes: impact of weather and culm biochemical parameters against sheath blight infection
DOI:10.3389/fpls.2023.1280321 URL
Genetic diversity and environmental influence on yield and yield-related traits of adzuki bean (Vigna angularis L.)
DOI:10.3390/plants11091132
URL
[本文引用: 1]
Adzuki beans are an important food legume crop in East Asia. A large number of adzuki bean accessions are maintained in the Chinese national seed genebank. A collection of 59 elite cultivars, 389 landraces, and 27 wild adzuki beans were selected and phenotyped extensively for yield and yield-related traits at two different locations (Nanning and Nanyang, China). Ten agronomic and yield-related traits were scored, and the data were subjected to analysis of variance (ANOVA), principal component analysis (PCA), correlation, and cluster analysis. Significant variation was observed for genotypes, locations, and genotype x environment interaction for most traits. Also, there were significant differences in the phenotypes among accessions of different germplasm types. The broad-sense heritability of traits studied ranged from 4.4% to 77.8%. The number of seeds per pod (77.8%), 100-seed weight (68.0%), and number of plant branches (63.9%) had a high heritability. A total of 10 traits were transformed into 3 comprehensive factors by principal component analysis, and the first three principal component factors contributed 72.31% of the total variability. Cluster analysis categorized the 475 adzuki bean accessions into five distinct groups. The results described in this study will be useful for adzuki bean breeders for the development of varieties with high end-use quality.
小豆种质资源农艺性状综合鉴定与评价
DOI:10.13430/j.cnki.jpgr.2014.06.007
[本文引用: 1]
通过田间观测和室内分析,对来自全国各生态区的262份小豆优异种质资源在北京试验田连续两年进行了农艺性状鉴定及综合评价。结果表明:262份小豆微核心种质资源在考察的16个形态学性状中均具有丰富的遗传变异类型;不同年份间生态环境尤其是光照条件对小豆农艺性状影响较大;主成分分析确定三类影响因子,表明小豆资源的选育要集中在生长势良好(生育日数较短、株高较矮),单株荚数和单荚粒数多的地方品种;聚类分析结果显示在相似系数为0.40时可将参试材料分为5大类群,各类群间性状差异明显;群体的性状表现跟地理来源之间没有直接的关系。
Short-day photoperiod effects on plant growth, flower bud differentiation, and yield formation in adzuki bean (Vigna angularis)
DOI:10.17957/IJAB URL [本文引用: 1]
小豆产量相关性状的基因型与环境互作效应及稳定性分析
DOI:10.3724/SP.J.1006.2025.54049
[本文引用: 1]
为明确我国小豆主栽品种的产量潜力、适应性与稳定性, 并指导区域化应用与育种, 本研究于2022年和2023年在我国主要产区遴选8个代表性生态试验点, 对15个小豆基因型进行了多点试验。运用联合方差分析、相关性分析、加性主效应与乘性互作(AMMI)模型及基因型与环境互作效应(GGE)双标图等方法, 对产量及相关农艺性状进行了系统评价。联合方差分析结果表明, 环境是影响除百粒重外各性状变异的主要驱动因素, 百粒重主要受基因型控制。基因型与环境互作效应对产量和主茎分枝数影响极显著。相关性分析显示, 单株荚数是决定产量的关键因子, 二者呈极显著正相关。AMMI与GGE分析揭示了显著的基因型×环境互作效应, 明确了基因型的特定适应区域与稳定性差异。综合评价显示, 赤红3号(G5)表现出高产潜力, 最接近理想基因型; 保红201429-8(G8)等基因型兼具高产与稳产特性;环境评价表明, 榆林(E5)试验点因其优良的代表性和区分能力, 被鉴定为理想测试环境。本研究表明, 环境效应对小豆产量性状具有显著影响, 基因型与环境互作是品种选育和推广中充分考量的关键因素,且单株荚数可作为小豆高产育种的核心选择指标。本研究为我国小豆育种策略的优化和品种的精准推广提供了关键数据支持与科学指导。
小豆种质资源产量性状的多环境评价与优异种质筛选
Interactions of genotype, environment and management on wheat traits and grain yield variations in different climate zones across China
DOI:10.1016/j.agsy.2022.103521 URL [本文引用: 1]
