
作物杂志,2016, 第1期: 162–168 doi: 10.16035/j.issn.1001-7283.2016.01.030
• 生理生化·植物营养·栽培耕作 • 上一篇
基于不同植被指数的VSWI在河南省春季干旱监测中的应用分析
李琪1,2,孙晓宇1,2,王连喜1,2,缪淼1,2,吴东丽3
- 1 江苏省农业气象重点实验室,210044,江苏南京
2 南京信息工程大学应用气象学院,210044,江苏南京
3 中国气象局气象探测中心,100081,北京
The Use of Vegetation Supply Water Index (VSWI) based on Different Vegetation Indices in the Spring Drought Monitoring in Henan Province
Li Qi1,2,Sun Xiaoyu1,2,Wang Lianxi1,2,Miao Miao1,2,Wu Dongli3
- 1 Jiangsu Key Laboratory of Agricultural Meteorology,Nanjing 210044,Jiangsu,China
2 College of Applied Meteorology,Nanjing University of Information Science & Technology,Nanjing 210044,Jiangsu,China;
3 Meteorological Observation Centre of China Meteorological Administration,Beijing 100081,China
摘要:
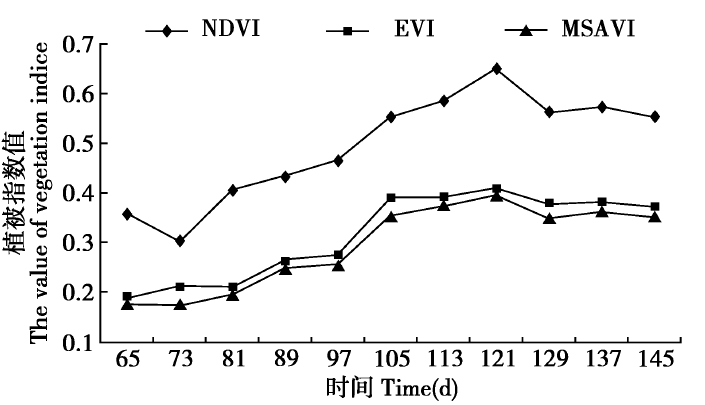
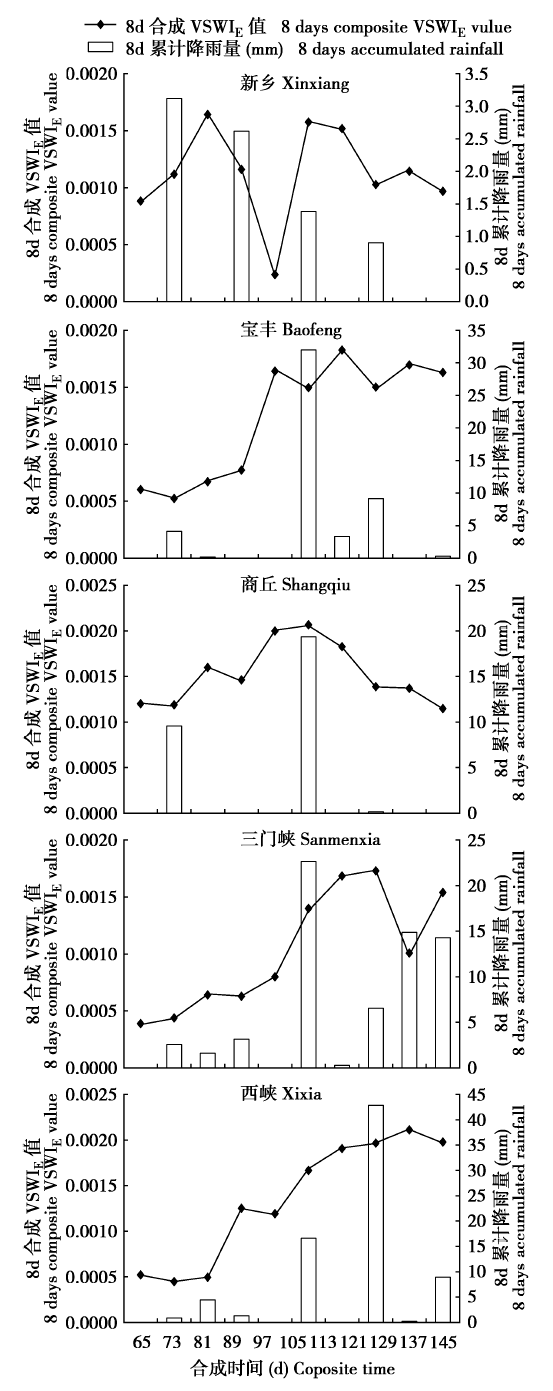
干旱是一种常见的自然灾害,严重影响着我国的农业生产,而河南省的春旱发生最为频繁。因此,以河南省为研究区,在分析河南省春季归一化植被指数(NDVI)、增强型植被指数(EVI)以及修正土壤调节植被指数(MSAVI)变化规律的基础上,构建其相应的遥感植被供水指数(VSWI),分析比较了这3种植被指数构建的VSWI在反映土壤干湿状况时的差异,讨论了VSWIN、VSWIE以及VSWIM与长时间序列降水的相关性。结果表明:VSWI与河南春季土壤相对湿度具有一定的正相关关系,VSWIE、VSWIM较VSWIN更适合监测表层水分变化信息,总体来说,VSWIE效果最好,而且,通过比较春季降水距平百分率(PA)发现,2000年是近30年春季最旱的一年。因此,选择利用EVI构建的VSWI监测2000年河南省春季干旱的时空演变规律,利用EVI构建的VSWIE总体上更适用于监测河南省的春季干旱。

| [1] | 王宗敏, 杨海波, 计淇才 , 等. 基于MODIS的河南省遥感干旱监测研究. 水土保持通报, 2012,32(1):139-143. |
| [2] | 赵广才, 常旭虹, 王德梅 , 等. 农业隐性灾害对小麦生产的影响与对策.作物杂志, 2011(5):1-7. |
| [3] | 朱业玉, 潘攀, 匡晓燕 , 等. 河南省干旱灾害的变化特征和成因分析. 中国农业气象, 2011,32(2):311-316. |
| [4] | 竹磊磊, 常军, 张善强 , 等. 河南夏季干旱气候特征分析. 气象与环境科学, 2012,35(1):49-55. |
| [5] | 房稳静, 林文全, 赵龙 , 等. 基于土壤墒情的河南省冬小麦干旱灾害特点及评估//中国气象学会.S10气象与现代农业发展.北京: 同方知网数字出版技术股份有限公司, 2012. |
| [6] | 李树岩, 刘荣花, 师丽魁 , 等. 基于CI指数的河南省近40a干旱特征分析. 干旱气象, 2009,27(2):97-102. |
| [7] | 李谢辉, 张超, 姚佳林 . 河南省干旱的时空分布规律与趋势分析. 西北师范大学学报(自然科学版), 2015,51(2):85-91. |
| [8] |
孙睿, 唐侥 . 基于气象和遥感数据的河南省干旱特征分析. 自然资源学报, 2013,28(4):646-652.
doi: 10.11849/zrzyxb.2013.04.011 |
| [9] |
沙莎, 郭铌, 李耀辉 , 等. 植被状态指数VCI与几种气象干旱指数的对比—以河南省为例. 冰川冻土, 2013,35(4):990-998.
doi: 10.7522/j.issn.1000-0240.2013.0111 |
| [10] | 张洁, 武建军, 周磊 , 等. 基于MODIS数据的农业干旱监测方法对比分析. 遥感信息, 2012,27(5):48-54. |
| [11] | 杨世琦, 易佳, 罗孽孽 , 等. 2006年重庆特大干旱期间的遥感监测应用研究. 中国农学通报, 2010,26(23):325-330. |
| [12] |
贺俊杰, 王英舜, 李云鹏 , 等. 利用EOS/MODIS植被供水指数监测锡林郭勒地区土壤湿度. 中国农业气象, 2013,34(2):243-248.
doi: 10.3969/j.issn.1000-6362.2013.02.018 |
| [13] | Goetz S J . Multi-sensor analysis of NDVI,surface temperature and biophysical variables at a mixed grassed land site. International Journal of Remote Sensing, 2010,18(1):71-94. |
| [14] | 杨峰, 李建龙, 钱育蓉 , 等. 天山北坡典型退化草地植被覆盖度监测模型构建与评价. 自然资源学报, 2012,27(8):1341-1347. |
| [15] | 杨波, 马苏, 王彬武 , 等. 基于MODIS的湖南省农业干旱监测模型. 自然资源学报, 2012,27(10):1788-1796. |
| [16] | 易佳 . 基于EOS-MODIS的重庆市干旱遥感监测技术研究. 重庆:西南大学, 2010. |
| [17] |
姜亚珍, 张瑜洁, 孙琛 , 等. 河北省土壤干湿状况遥感监测指数比较. 中国农业气象, 2014,35(6):675-681.
doi: 10.3969/j.issn.1000-6362.2014.06.011 |
| [18] |
Wan Z, Wang P, Li X . Using MODIS land surface temperature and normalized difference vegetation index products for monitoring drought in the southern great plains,USA. International Journal of Remote Sensing, 2004,25(1):61-72.
doi: 10.1080/0143116031000115328 |
| [19] |
Song Y K, Njoroge J B, Yukihiro M . Drought impact assessment from monitoring the seasonality of vegetation condition using long-term time-series satellite images:a case study of Mt. Kenya region. Environmental Monitoring and Assessment, 2013,185(5):4117-4124.
doi: 10.1007/s10661-012-2854-z |
| [20] | 杨世琦, 高阳, 徐永进 . 基于植被供水指数的重庆夏季干旱状况评估//中国气象学会.创新驱动发展提高气象灾害防御能力——S2灾害天气监测、分析与预报.北京: 同方知网数字出版技术股份有限公司, 2013. |
| [21] |
耿婷, 付伟, 陈群 , 等. 近20年河南省冬小麦生育期气候资源的时空变化及其适应性研究. 麦类作物学报, 2013,33(4):652-661.
doi: 10.7606/j.issn.1009-1041.2013.04.006 |
| [22] | 包欣 . 基于多源数据的旱情监测方法研究——以河南示范区为例. 淮南:安徽理工大学, 2013. |
| [23] | 李华朋, 张树清, 高自强 , 等. MODIS植被指数监测农业干旱的适宜性评价. 光谱学与光谱分析, 2013,33(3):756-761. |
| [24] |
房世波, 齐月, 韩国军 , 等. 1961-2010年中国主要麦区冬春气象干旱趋势及其可能影响. 中国农业科学, 2014,47(9):1754-1763.
doi: 10.3864/j.issn.0578-1752.2014.09.010 |
| [25] | 伏毅, 戴媛, 谭晓荣 , 等. 干旱对小麦幼苗脂类和蛋白质氧化损伤的影响.作物杂志, 2010(3):45-50. |
| [1] | 王连喜,刘畅,李琪,吴东丽,王清,成威. 气候变暖背景下京津冀地区冬小麦种植北界变化[J]. 作物杂志, 2017, (1): 61–67 |
|