作物杂志,2020, 第6期: 180–188 doi: 10.16035/j.issn.1001-7283.2020.06.027

• 农业信息技术 • 上一篇    下一篇

基于全波段高光谱的冬小麦生长参数估算方法比较

纪景纯1,2(), 刘建立1, 牛玉洁1,2, 宣可凡1,2, 蒋一飞1,2, 邓皓东1,3, 李晓鹏1()   

  1. 1中国科学院南京土壤研究所,210008,江苏南京
    2中国科学院大学,100049,北京
    3河海大学水文水资源学院,210008,江苏南京
  • 收稿日期:2020-02-26 修回日期:2020-04-24 出版日期:2020-12-15 发布日期:2020-12-09
  • 通讯作者: 李晓鹏
  • 作者简介:纪景纯,主要从事植物营养与无人机遥感研究,E-mail: jcji@issas.ac.cn
  • 基金资助:
    国家重点研发计划(2016YFD0300601);国家自然科学基金面上项目(41877021);国家自然科学基金面上项目(41771265)

Comparison of Estimation Methods for Growth Parameters of Winter Wheat Based on Full-Band Hyperspectral Data

Ji Jingchun1,2(), Liu Jianli1, Niu Yujie1,2, Xuan Kefan1,2, Jiang Yifei1,2, Deng Haodong1,3, Li Xiaopeng1()   

  1. 1Institute of Soil Science, Chinese Academy of Sciences, Nanjing 210008, Jiangsu, China
    2University of the Chinese Academy of Sciences, Beijing 100049, China
    3Hydrology and Water Resources College, Hohai University, Nanjing 210008, Jiangsu, China
  • Received:2020-02-26 Revised:2020-04-24 Online:2020-12-15 Published:2020-12-09
  • Contact: Li Xiaopeng

摘要:

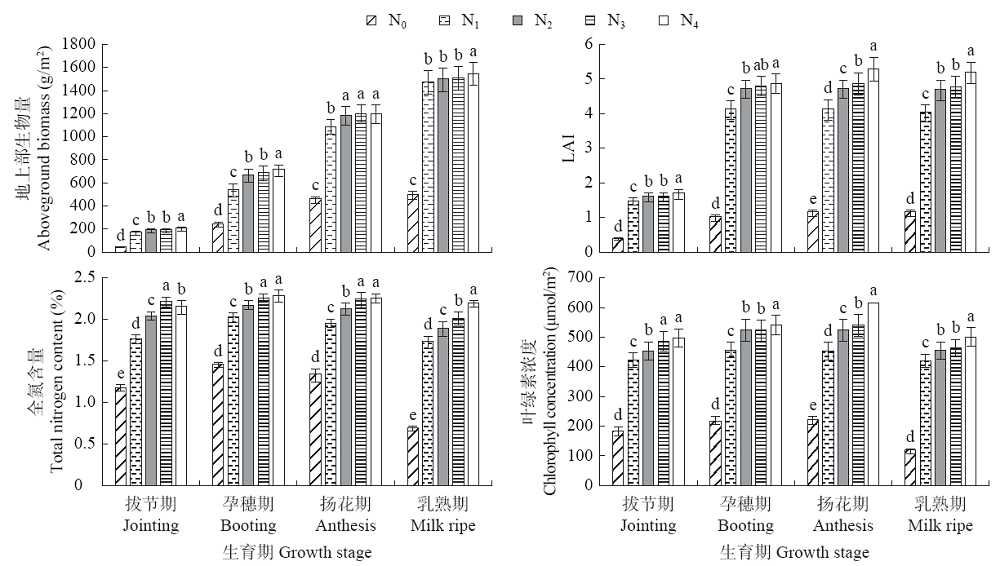
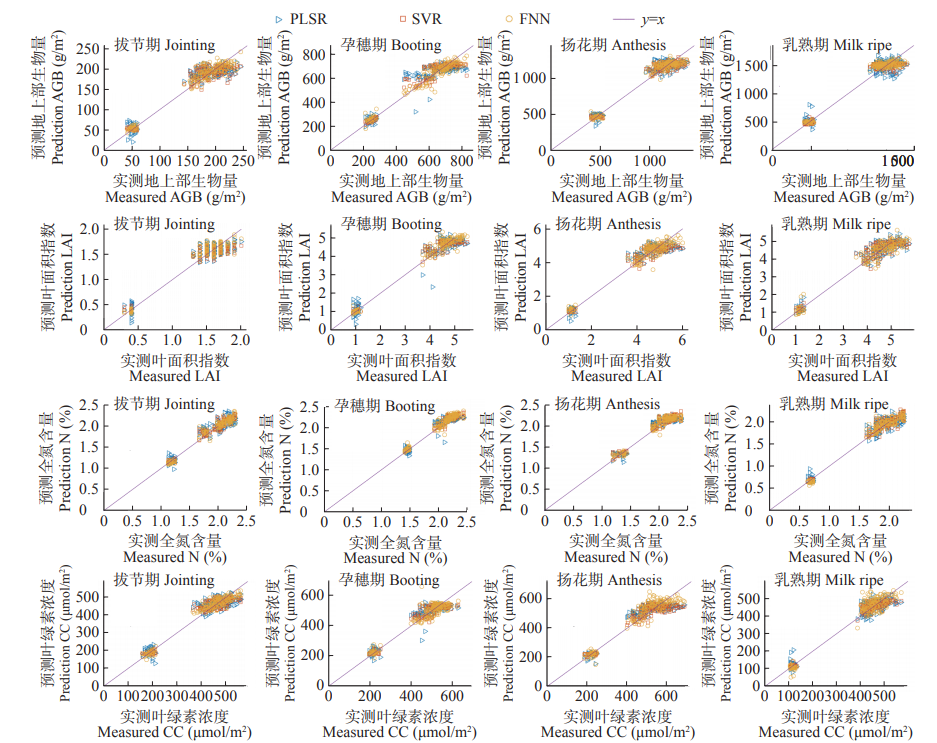
利用高光谱数据监测作物生长情况具有无损和高效的特点,是现代农业的发展方向。为了简化高光谱数据处理流程,直接利用原始的高光谱反射率完成从建模到估算作物生长参数的全过程,应用于作物长势的实时监测。本文利用偏最小二乘回归(partial least squares regression,PLSR)、支持向量回归(support vector regression,SVR)和前馈神经网络(feedforward neural network,FNN)3种方法,利用全波段高光谱数据分别对冬小麦多个关键生育期(拔节、孕穗、扬花和乳熟期)生长参数(地上部生物量、叶面积指数、全氮含量和叶绿素浓度)进行了估算。比较3种方法的建模及估测效果,发现对于建模集数据,SVR对上述生长参数4个生育期的估测结果R2均值为0.89~0.98,MAPE为1.70%~7.53%,对于验证集数据,R2均值为0.90~0.94,MAPE为4.04%~7.46%,拟合优度和估测精度均超过PLSR和FNN,是估算方法中利用全波段光谱反射率估测冬小麦生长参数的最佳方案。随着无人机载高光谱技术成熟,SVR方法能够用于处理航拍获取的大范围田间高光谱信息,简便快捷地进行建模与参数反演,实时反映作物生长状态。

关键词: 高光谱遥感, 偏最小二乘回归, 支持向量回归, 前馈神经网络, 作物生长监测

Abstract:

Hyperspectral data monitoring in crop growth status has the characteristics of nondestructive and efficient, which will be the developing direction of modern agriculture. In order to simplify the hyperspectral data processing procedure and apply to the real-time monitoring of crop growth, the original hyperspectal reflectance was directly used to complete the whole process from modeling to estimating the crop growth patameters and three methods including partial least square regression (PLSR), support vector regression (SVR) and feed forward neural network (FNN) were used to estimate the growth parameters (aboveground biomass, leaf area index, total nitrogen content and chlorophyll concentration) of winter wheat at multiple key growth stages (jointing, booting, anthesis and milk ripe stage) based on full-band hyperspectral data, respectively. The modeling and estimation performances of the three methods were also compared. For the SVR method, the mean R2 of the above growth parameters during the four growth periods was between 0.89 and 0.98, while MAPE was between 1.70% and 7.53% in calibration set and the mean R2 of the above growth parameters during the four growth periods was between 0.90 and 0.94, while MAPE was in between 4.04% and 7.46% in validation set. Both the interpretation of parameters and the estimation accuracy were higher than PLSR and FNN methods, which illustrated that the SVR method performed best in estimating winter wheat growth parameters using all-band spectral reflectance in the tested methods. With the maturity of UAV-based hyperspectral technology, the SVR method can be used to process a wide range of field hyperspectral information obtained fromaerial photography, facilitate modeling and parameter inversion, and reflect crop growth status in time.

Key words: Hyperspectral remote sensing, Partial least squares regression, Support vector regression, Feedforward neural network, Monitoring of crop growth parameters

图1

氮肥梯度试验布置 N0、N1、N2、N3和N4分别为0、150、190、230和270kg/hm2

表1

FNN隐层节点数设置

生长参数
Growth parameter
拔节期
Jointing
stage
孕穗期
Booting
stage
扬花期
Anthesis
stage
乳熟期
Milk ripe
stage
地上部生物量Aboveground biomass 15 15 15 15
LAI 15 25 25 15
全氮含量
Total nitrogen content
25 15 15 15
叶绿素浓度
Chlorophyll concentration
25 25 15 15

图2

不同氮肥梯度下冬小麦生长参数 不同小写字母表示在0.05水平下差异显著

图3

不同氮肥梯度下冬小麦冠层光谱反射率

图4

PLSR、SVR和FNN模型对建模集样本的估算结果

表2

PLSR、SVR和FNN模型的建模评价指标

模型Model 生育期
Growth stage
地上部生物量
Aboveground biomass
LAI 全氮含量
Total nitrogen content
叶绿素浓度
Chlorophyll concentration
R2 RMSE
(g/m2)
MAPE
(%)
R2 RMSE MAPE
(%)
R2 RMSE
(%)
MAPE
(%)
R2 RMSE
(μmol/m2)
MAPE
(%)
PLSR 拔节期Jointing 0.90 18.61 10.58 0.93 0.13 9.43 0.90 0.12 4.96 0.91 34.51 7.03
孕穗期Booting 0.87 63.87 8.73 0.95 0.34 9.22 0.92 0.09 3.36 0.91 37.43 6.65
扬花期Anthesis 0.92 79.83 6.57 0.93 0.39 8.46 0.91 0.10 4.44 0.86 50.92 8.40
乳熟期Milk ripe 0.91 124.83 8.09 0.94 0.36 7.84 0.94 0.13 6.40 0.94 35.01 8.19
SVR 拔节期Jointing 0.92 16.31 7.53 0.95 0.11 5.46 0.98 0.05 1.70 0.94 28.02 4.93
孕穗期Booting 0.91 53.30 6.36 0.97 0.25 4.55 0.97 0.05 1.70 0.93 32.54 5.32
扬花期Anthesis 0.94 72.77 5.38 0.94 0.35 5.96 0.94 0.08 3.14 0.89 45.00 6.49
乳熟期Milk ripe 0.95 94.46 5.25 0.95 0.32 5.65 0.97 0.10 3.54 0.96 26.25 4.70
FNN 拔节期Jointing 0.93 15.37 7.58 0.96 0.10 6.03 0.97 0.06 2.13 0.96 24.50 4.45
孕穗期Booting 0.92 49.69 6.80 0.96 0.29 5.96 0.96 0.07 2.25 0.93 33.44 5.26
扬花期Anthesis 0.94 71.72 5.49 0.95 0.35 7.13 0.93 0.09 3.46 0.90 45.00 7.35
乳熟期Milk ripe 0.95 93.57 5.59 0.96 0.30 6.65 0.97 0.10 4.24 0.96 27.70 5.93

图5

PLSR、SVR和FNN模型对验证集样本的估算结果

表3

PLSR、SVR和FNN模型的估算评价指标

模型
Model
生育期
Growth stage
地上部生物量
Aboveground biomass
LAI 全氮含量
Total nitrogen content
叶绿素浓度
Chlorophyll concentration
R2 RMSE
(g/m2)
MAPE
(%)
R2 RMSE MAPE
(%)
R2 RMSE
(%)
MAPE
(%)
R2 RMSE
(μmol/m2)
MAPE
(%)
PLSR 拔节期Jointing 0.89 20.03 11.15 0.92 0.14 10.75 0.90 0.12 5.31 0.91 34.67 7.13
孕穗期Booting 0.87 64.19 8.73 0.95 0.35 9.44 0.92 0.09 3.36 0.91 37.31 6.78
扬花期Anthesis 0.92 80.70 6.60 0.93 0.40 8.62 0.91 0.11 4.57 0.86 50.38 8.31
乳熟期Milk ripe 0.91 127.58 8.34 0.94 0.37 8.00 0.94 0.13 6.46 0.94 36.01 8.44
SVR 拔节期Jointing 0.90 19.09 9.16 0.93 0.13 6.98 0.95 0.08 3.31 0.92 33.13 6.36
孕穗期Booting 0.89 59.99 8.23 0.96 0.31 6.69 0.93 0.08 3.05 0.92 35.20 6.16
扬花期Anthesis 0.93 77.44 5.99 0.93 0.39 7.38 0.90 0.11 4.77 0.86 50.97 8.11
乳熟期Milk ripe 0.94 103.96 6.44 0.94 0.35 7.15 0.95 0.11 5.04 0.95 31.26 6.74
FNN 拔节期Jointing 0.88 20.82 11.09 0.92 0.14 8.42 0.94 0.10 3.87 0.89 39.24 7.93
孕穗期Booting 0.87 64.40 9.22 0.92 0.42 9.26 0.91 0.09 3.63 0.88 44.20 7.83
扬花期Anthesis 0.91 88.01 7.19 0.90 0.49 10.34 0.90 0.11 4.76 0.86 52.52 8.71
乳熟期Milk ripe 0.92 118.21 7.51 0.92 0.42 9.60 0.94 0.13 6.16 0.94 36.61 8.44
[1] Li X C, Zhang Y J, Bao Y S, et al. Exploring the best hyperspectral features for LAI estimation using partial least squares regression. Remote Sensing, 2014,6(7):6221-6241.
doi: 10.3390/rs6076221
[2] Jia M, Li W, Wang K K, et al. A newly developed method to extract the optimal hyperspectral feature for monitoring leaf biomass in wheat. Computers and Electronics in Agriculture, 2019,165(1):1-7.
[3] Duan D D, Zhao C J, Li Z H, et al. Estimating total leaf nitrogen concentration in winter wheat by canopy hyperspectral data and nitrogen vertical distribution. Journal of Integrative Agriculture, 2019,18(7):1562-1570.
doi: 10.1016/S2095-3119(19)62686-9
[4] Huang L S, Zhang H S, Ding W J, et al. Monitoring of wheat scab using the specific spectral index from ASD hyperspectral dataset. Journal of Spectroscopy, 2019: 9153195.
[5] Bao Y D, Mi C X, Wu N, et al. Rapid classification of wheat grain varieties using hyperspectral imaging and chemometrics. Applied Sciences, 2019,9(19):4119-4135.
doi: 10.3390/app9194119
[6] 田明璐, 班松涛, 常庆瑞, 等. 基于无人机成像光谱仪数据的棉花叶绿素含量反演. 农业机械学报, 2016,47(11):285-293.
[7] 梁栋, 杨勤英, 黄文江, 等. 基于小波变换与支持向量机回归的冬小麦叶面积指数估算. 红外与激光工程, 2015,44(1):335-340.
[8] Curran P J, Dungan J L, Macler B A, et al. Reflectance spectroscopy of fresh whole leaves for the estimation of chemical concentration. Remote Sensing of Environment, 1992,39(2):153-166.
doi: 10.1016/0034-4257(92)90133-5
[9] Osborne S, Schepers J S, Schlemmer M. Using multi-spectral imagery to evaluate corn grown under nitrogen and drought stressed conditions. Journal of Plant Nutrition, 2004,27(11):1917-1929.
doi: 10.1081/PLN-200030042
[10] Thenkabail P S, Smith R B, De Pauw E. Hyperspectral vegetation indices and their relationships with agricultural crop characteristics. Remote Sensing of Environment, 2000,71(2):158-182.
doi: 10.1016/S0034-4257(99)00067-X
[11] 陆国政, 李长春, 杨贵军, 等. 基于成像高光谱仪的大豆叶面积指数反演研究. 大豆科学, 2016,35(4):599-608.
[12] Svante W, Sjöström M, Eriksson L. PLS-regression:a basic tool of chemometrics. Chemometrics and Intelligent Laboratory Systems, 2001,58(2):109-130.
doi: 10.1016/S0169-7439(01)00155-1
[13] Cherkassky V. The nature of statistical learning theory. IEEE Transactions on Neural Networks, 1997,8(6):1564.
doi: 10.1109/TNN.1997.641482 pmid: 18255760
[14] Hsu C W, Lin C J. A comparison of methods for multiclass support vector machines. IEEE Transactions on Neural Networks, 2002,13(2):415-425.
doi: 10.1109/72.991427 pmid: 18244442
[15] Fulkerson B. Machine learning,neural and statistical classification. Technometrics, 1997,37(4):459-459.
doi: 10.1080/00401706.1995.10484383
[16] Cheng C M, Wei Y C, Xu J J, et al. Remote sensing estimation of chlorophyll a and suspended sediment concentration in turbid water based on spectral separation. Optik, 2013,124(24):6815-6819.
doi: 10.1016/j.ijleo.2013.05.078
[17] 梁栋, 杨勤英, 黄文江, 等. 基于小波变换与支持向量机回归的冬小麦叶面积指数估算. 红外与激光工程, 2015,44(1):335-340.
[18] 贺佳, 刘冰峰, 郭燕, 等. 冬小麦生物量高光谱遥感监测模型研究. 植物营养与肥料学报, 2017,23(2):313-323.
[19] 贾学勤, 冯美臣, 杨武德, 等. 基于多植被指数组合的冬小麦地上干生物量高光谱估测. 生态学杂志, 2018,37(2):424-429.
[1] 裴宇峰, 栾怀海, 刘春燕, 等. 黑龙江省大豆蛋白质和油分含量与环境因素的相关分析[J]. 作物杂志, 2013, (2): 37–41
Viewed
Full text


Abstract

Cited

  Shared   
  Discussed   
No Suggested Reading articles found!