
作物杂志,2026, 第2期: 238–246 doi: 10.16035/j.issn.1001-7283.2026.02.030
土壤水分对数字图像估算土壤有机碳的影响
王梓阳( ), 贾浩, 赵钰, 张美俊, 冯美臣, 王超, 杨武德()
山西农业大学农学院 030801, 山西晋中
Effects of Soil Moisture on Digital Image Estimation of Soil Organic Carbon
Wang Ziyang(), Jia Hao, Zhao Yu, Zhang Meijun, Feng Meichen, Wang Chao, Yang Wude()
College of Agronomy ,Shanxi Agricultural University, Jinzhong 030801 Shanxi, China
摘要:
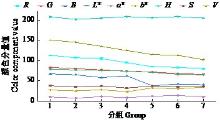
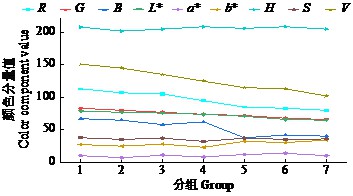
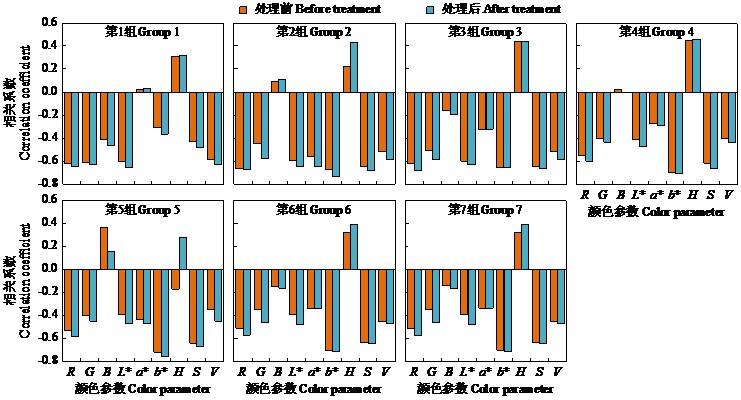
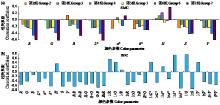
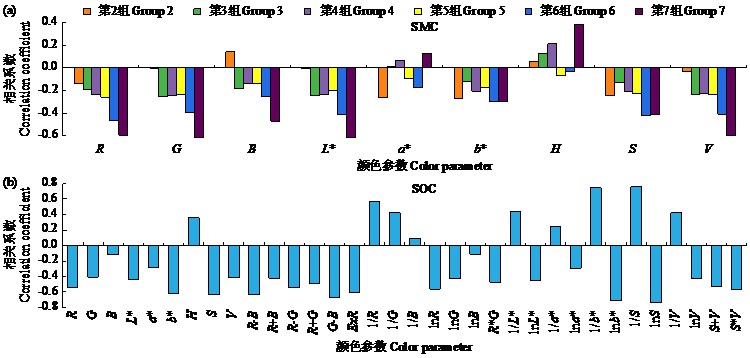
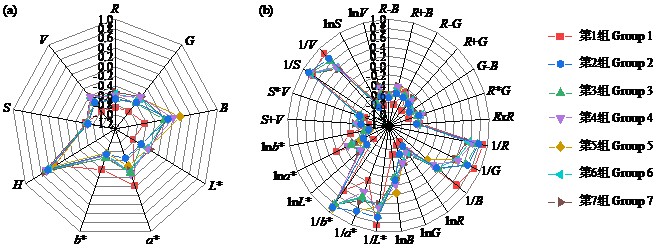
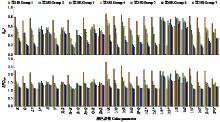
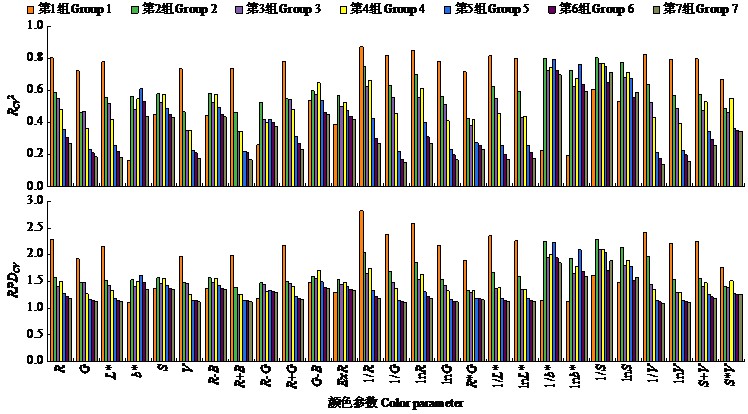
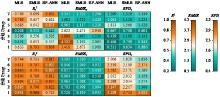
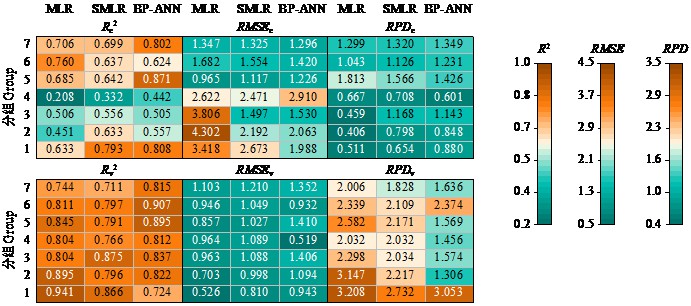
为探索土壤水分变化对土壤有机碳(SOC)与颜色特征参数关系的影响,并构建基于颜色参数的SOC定量预测模型,通过模拟农田土壤水分的连续变化获取不同土壤含水量(SMC)条件下的土样图像,提取颜色特征参数,采用多种数学变换方法对颜色参数进行优化,结合相关性分析和回归模型量化土壤水分对颜色特征与SOC关系的影响,构建不同含水量下的SOC定量估算模型。结果表明,SOC与颜色特征参数在RGB、HSV和CIELab 3种颜色空间中呈显著负相关,且R、L和V分量值与SOC的相关性最高,颜色参数的倒数和对数变换能够增强其相关性。土壤水分影响颜色分量值,随着土壤含水量的增加,多数颜色参数值降低,且与SOC的相关性逐渐减弱。临界含水量为SMC=15%时,1/b*、lnb*、1/S和lnS等颜色参数能够有效减轻水分对SOC预测模型的影响。在不同水分条件下,BP神经网络回归模型优于线性回归模型,表现出更好的预测能力。研究表明数字图像的颜色特征参数可用于SOC的定量分析。
| [1] | 吕雪梅. 减水减肥对设施菜田黑土团聚体及土壤有机碳组成的影响. 哈尔滨: 黑龙江大学, 2023. |
| [2] |
Bruun S, Stenberg B, Breland T A, et al. Empirical predictions of plant material C and N mineralization patterns from near infrared spectroscopy, stepwise chemical digestion and C/N ratios. Soil Biology and Biochemistry, 2005, 37:2283-2296.
doi: 10.1016/j.soilbio.2005.04.006 |
| [3] |
Shi Z, Rossel R A V, Chen S, et al. Prediction of soil organic matter using a spatially constrained local partial least squares regression and the Chinese vis-NIR spectral library. European Journal of Soil Sciences, 2015, 66:679-687.
doi: 10.1111/ejss.2015.66.issue-4 |
| [4] |
Gregory S D L, Lauzon J D, O'Halloran I P, et al. Predicting soil organic matter content in southwestern Ontario fields using imagery from high-resolution digital cameras. Canadian Journal of Soil Sciences, 2006, 86:573-584.
doi: 10.4141/S05-043 |
| [5] | Rossel R A V, Walter C. Towards a quantitative assessment of field soil organic carbon using proximally sensed digital imagery. Congress of Soil Science, 2002, 48:1523. |
| [6] |
Rossel R A V, Fouad Y, Walter C, et al. Using a digital camera to measure soil organic carbon and iron contents. Biosystems Engineering, 2008, 100(2):149-159.
doi: 10.1016/j.biosystemseng.2008.02.007 |
| [7] | Aitkenhead M J, Donnelly D, Coull M, et al. E-SMART: environmental sensing formonitoring and advising in real-time. Commun Technolgy, 2013, 413:129-142. |
| [8] |
Nocita M, Stevens A, Noon C, et al. Prediction of soil organic carbon for different levels of soil moisture using Vis-NIR spectroscopy. Geoderma, 2013, 199:37-42.
doi: 10.1016/j.geoderma.2012.07.020 |
| [9] | 双龙, 妮萨娜, 杜江, 等. 重铬酸钾氧化-外加热法测定化探土壤样品中有机碳含量. 安徽化工, 2016, 42(4):110-112. |
| [10] | 徐芙姗, 徐海松, 王勇. 孟塞尔色序系统与CIE1931标准色度系统转换新算法. 光子学报, 2007, 36(4):650-654. |
| [11] |
郭耀东, 王飞, 董少杰, 等. 红葡萄酒CIELAB参数与花色素的主成分多元线性回归分析. 食品科学, 2019, 40(18):210-215.
doi: 10.7506/spkx1002-6630-20190408-080 |
| [12] | 王惠文, 孟洁. 多元线性回归的预测建模方法. 北京航空航天大学学报, 2007, 33(4):500-504. |
| [13] | 秦小立, 叶露, 李玉萍, 等. 基于图像处理的作物营养诊断研究进展. 热带农业科学, 2016, 36(9):101-108. |
| [14] | Nawar S, Budden H, Hill J, et al. Estimating the soil clay content and organic matter by means of different calibration methods of vis-NIR diffuse reflectance spectroscopy. Soil & Tillage Research, 2016, 155(5):510-522. |
| [15] | 李友坤. BP神经网络的研究分析及改进应用. 淮南: 安徽理工大学, 2012. |
| [16] | 张培松, 孙毅明, 郭澎涛, 等. 基于数字图像分析技术的橡胶树叶片氮含量预测. 热带作物学报, 2015, 36(12):2120-2124. |
| [17] | 李春苗, 李敏. 2土壤颜色与性状探讨//2013年江苏省地基基础联合学术年会论文集, 2013:114-117. |
| [18] | 段祥石, 蒋端生, 蒋祖丰. 南岳山森林土壤颜色与有机质关系. 安徽农业科学, 2015, 43(22):80-82. |
| [19] | Aziz T M I, Islam R. Impact of long-term tillage and crop rotation on concentration of soil particulate organic matter associated carbon and nitrogen. Pakistan Journal of Agricultural Sciences, 2014, 51(4):827-835. |
| [20] |
Aitkenhead M J, Cameron C, Gaskin G, et al. Digital RGB photography and visible-range spectroscopy for soil composition analysis. Geoderma, 2018, 313:265-275.
doi: 10.1016/j.geoderma.2017.11.020 |
| [21] |
Stevens A, van Wesemael B, Bartholomeus H, et al. Laboratory, field and airborne spectroscopy for monitoring organic carbon content in agricultural soils. Geoderma, 2008, 144:395-404.
doi: 10.1016/j.geoderma.2007.12.009 |
| [22] | Tian N, Wang Y X, Weng B Q, et al. Advances in estimating soil carbon storage. Subtropical Agriculture Research, 2010, 6(3):193-198. |
| [23] | 吴才武, 杨越, 夏建新. 基于RGB的黑土有机质快速测定方法研究. 土壤通报, 2016, 47(4):853-859. |
| [24] | 吴才武, 杨浩, 夏建新, 等. 基于数字图像颜色提取的土壤有机质预测研究. 光谱学与光谱分析, 2019, 39(4):1222-1228. |
| [25] | 曾华俊, 明瑞星, 苏培娟, 等. 响应变量缺失下条件平均处理效应的k近邻核估计. 数学物理学报, 2025, 45(3):992-1012. |
| [1] | 范国华, 冯晓敏, 高翔, 吕慧卿, 杨静, 张旭丽, 郝志萍, 周忠宇, 张力, 李洪. 垄作覆膜与有机肥施用对小粒黑豆产量形成及土壤有机碳组分的影响[J]. 作物杂志, 2025, (6): 240–247 |
| [2] | 罗晓颖, 房彦飞, 胡冬平, 唐江华, 徐文修, 王怀港. 播种方式和播量对干旱区旱地小麦土壤水分利用及产量的影响[J]. 作物杂志, 2024, (2): 97–104 |
| [3] | 张海涛, 闫晓斌, 冯美臣, 杨武德, 肖璐洁, 宋晓彦, 张美俊, 王乐乐, 王超. 土壤水分的高光谱响应特性及定量监测研究[J]. 作物杂志, 2023, (1): 233–238 |
| [4] | 郭书亚, 尚赏, 王坤, 付国占, 卢广远. 秸秆覆盖深松对夏玉米田土壤有机碳库的影响[J]. 作物杂志, 2022, (2): 113–118 |
| [5] | 王会文, 李蕾, 余少波, 王强, 冯玉, 任爱霞, 林文, 孙敏, 高志强. 干旱年型深翻与探墒沟播对旱地小麦产量形成的贡献[J]. 作物杂志, 2020, (6): 116–122 |
| [6] | 任永峰,路战远,赵沛义,高宇,刘广华,栗艳芳. 不同种植方式对旱地马铃薯水分利用及的影响[J]. 作物杂志, 2019, (5): 120–124 |
| [7] | 王晓娟,赵圆峰,王娟玲,翟广谦,刘恩科,董春林,闫六英,张伟,姜春霞,张正. 不同覆盖方式对大棚滴灌番茄水分利用和经济效益的影响[J]. 作物杂志, 2018, (2): 103–107 |
| [8] | 李春喜,张令令,马守臣,邵云,陈惠婷,王敬婼. 有机物料还田对麦田土壤碳氮含量、小麦产量及经济效益的影响[J]. 作物杂志, 2017, (2): 145–150 |
| [9] | 于小彬,蒙美莲,刘素军,张婷婷,孟丽丽,焦瑞枣,陈有君. 施肥对马铃薯农田土壤水分时空变化及产量的影响[J]. 作物杂志, 2016, (3): 151–157 |
| [10] | 张昊,郝春雷,孟繁盛,慈艳华,郑伟,张丽研,边丽梅,董喆,霍剑锋. 膜下滴灌条件下不同灌水量对玉米产量及土壤水分的影响[J]. 作物杂志, 2016, (1): 105–109 |
| [11] | 王亚路, 滑丽娜, 田伟丽, 等. 不同水分处理对设施马铃薯氮淋洗、水分及氮利用效率的影响[J]. 作物杂志, 2015, (6): 99–105 |
| [12] | 包开花, 蒙美莲, 陈有君, 等. 覆膜方式和保水剂对旱作马铃薯土壤水热效应及出苗的影响[J]. 作物杂志, 2015, (4): 102–108 |
| [13] | 米俊珍, 刘景辉, 李立军, 等. 保水材料对旱作谷子苗期生长特性及土壤水分的影响[J]. 作物杂志, 2014, (4): 105–111 |
| [14] | 华劲松. 花荚期土壤水分胁迫对芸豆光合生理及产量性状的影响[J]. 作物杂志, 2013, (2): 111–114 |
| [15] | 孙培良, 杨士恩, 徐法彬, 刘顼, 李又君, 冯彩波. 鲁西北平原农田土壤水分对小麦产量的影响[J]. 作物杂志, 2012, (4): 65–69 |
|
||