Crops ›› 2023, Vol. 39 ›› Issue (5): 197-203.doi: 10.16035/j.issn.1001-7283.2023.05.028

Previous Articles     Next Articles

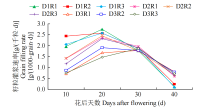
Responses of Dry Matter Translocation and Yield Formation to Planting Density and Row Spacing of Sunflower

Ling Yibo1(), Wang Binjie2, Hu Yimin3, Heinar·Madithermic mann4, Chen Nianlai5()   

  1. 1Rural Energy Workstation of Xinjiang Uygur Autonomous Region, Urumqi 830049, Xinjiang, China
    2Gansu Research Academy of Forestry Science and Technology, Lanzhou 730020, Gansu, China
    3National Academy of Agricultural Science and Technology Strategy, China Agricultural University, Beijing 100193, China
    4Xinjiang Agricultural Technology Extension Station, Urumqi 830049, Xinjiang, China
    5College of Resource and Environmental Engineering, Gansu Agricultural University, Lanzhou 730070, Gansu, China
  • Received:2022-03-05 Revised:2022-06-29 Online:2023-10-15 Published:2023-10-16

Abstract:

In the oasis of the middle reaches of Shiyang River, the experiment was designed by three planting densities of 39 990 (D1), 49 990 (D2), and 66 660 plants/ha (D3) and three row spacing of 0.7 (R1), 0.6 (R2), and 0.5m (R3), the responses of dry matter distribution and yield formation to planting density and row spacing were studied. The results showed as follows: the rules of dry matter accumulation and distribution of sunflower were different under different treatments. With the increasing of density, the harvest index increased firstly and then decreased (0.32-0.35-0.31). The dry matter transfer amount and transfer rate increased with the increase of density before flowering, while the dry matter accumulation and transfer amount decreased with the increased of density after flowering. For D1 and D2, R2 had the lowest dry matter transport efficiency, which were 6.58% and 8.22% before flowering, and had the highest dry matter accumulation amount, which were 3117 and 3088kg/ha after flowering. The grain filling process of sunflower was accorded with the curve described by logistic equations. With the increased of density, the average grain filling rate decreased from 1.72 to 1.06g/(1000- grain·d), and the filling duration extended from 47.17 to 55.84d. With the increase of row spacing, the average filling rate first increased from 1.39 to 1.49, and to 1.34g/(1000-grain·d), the filling duration first decreased from 51.09 to 49.74d, and then increased to 51.78d. With the increase of planting density, the number of effective discs and the rate of aborted seeds increased, while the number of grains per disc, 1000-grain weight and grain weight per disc decreased. The yield components were interacted to influence yield formation. The optimal planting density for high-yield of sunflower in the oasis of Shiyang River Basin was 49 990 plants/ha, and the optimal row spacing was 0.60m×0.33m.

Key words: Sunflower, Density, Row spacing, Dry matter distribution, Grain filling, Path analysis

Table 1

Experiment treatments"

密度
Density
行距Row spacing
R1 R2 R3
D1 T1(0.36) T2(0.42) T3(0.50)
D2 T4(0.29) T5(0.33) T6(0.40)
D3 T7(0.21) T8(0.25) T9(0.30)

Table 2

Dry matter amounts of different organs for mature stage under different treatments"

密度
Density
行距
Row
spacing
花盘
Disk

Stem

Leaf
地上生物量
Aboveground biomass
收获指数
Harvest
index
单株
Single plant
(g)
群体
Group
(kg/hm2)
单株
Single plant
(g)
群体
Group
(kg/hm2)
单株
Single plant
(g)
群体
Group
(kg/hm2)
单株
Single plant
(g)
群体
Group
(kg/hm2)
D1 R1 111.9b 4467abcd 70.8ab 2831a 42.4ab 2122ab 239.6a 9998ab 0.32d
R2 119.7a 4764ab 71.9a 2877a 47.2a 2360a 254.0a 10 610a 0.32bcd
R3 109.5b 4379bcd 70.6ab 2824a 46.9a 2346a 241.2a 10 117ab 0.33abc
均值 113.7 4537 71.1 2844 45.5 2276 244.9 10 242 0.32
D2 R1 93.2cd 4658abc 58.9bc 2946a 33.1b 1660b 194.1bc 9721ab 0.35ab
R2 95.3c 4870a 62.9abc 3145a 33.9b 1754b 202.0b 10 264ab 0.36a
R3 86.1d 4304cd 52.1cd 2606a 33.0b 1650b 179.7c 8988bc 0.34ab
均值 91.5 4610 58.0 2899 33.3 1688 191.9 9658 0.35
D3 R1 64.5de 4290cd 40.2d 2679a 21.7c 1085c 133.3de 8514cd 0.29d
R2 71.3e 4751ab 45.7d 3047a 22.9c 1143c 147.9d 9471ab 0.30cd
R3 61.5e 4097d 39.6d 2641a 20.3c 1017c 127.0e 8131d 0.34ab
均值 65.8 4379 41.8 2789 21.6 1082 136.1 8705 0.31

Table 3

Translocation and accumulation of dry matter of sunflower under different treatments"

密度
Density
行距
Row
spacing
花前干物质Dry matter before flowering 花后干物质Dry matter after flowering 光能利
用效率
PUE (%)
干物质量
Dry matter amount
(kg/hm2)
转移量
Transfer amount
(kg/hm2)
转移率
Transfer
rate (%)
积累量
Accumulation
amount (kg/hm2)
转移量对籽粒产量的贡献率
Contribution rate of transfer
amount to grain yield (%)
D1 R1 6644ab 475b 6.81c 2675ab 89.34a 0.74ab
R2 6936a 456b 6.58c 3117a 94.41a 0.78a
R3 6455ab 601ab 9.31abc 2573ab 78.84ab 0.74ab
均值 6678 511 7.57 2788 87.53 0.75
D2 R1 6756ab 568ab 8.41bc 3061a 87.38ab 0.73ab
R2 6957a 486b 8.22bc 3088a 90.40a 0.78a
R3 6229b 766ab 12.30ab 2412b 79.77ab 0.69bc
均值 6647 607 9.64 2854 85.85 0.73
D3 R1 6455ab 862a 13.88a 2299b 77.57ab 0.69bc
R2 6233b 644ab 10.95abc 2083b 71.03b 0.73ab
R3 6662ab 624ab 9.36abc 2532ab 81.33ab 0.65c
均值 6450 710 11.40 2305 76.64 0.69

Table 4

Fitting functions of the filling process under different treatments"

密度
Density
行距
Row
spacing
千粒重拟合方程
Fitting equation for
1000-grain weight
理论千粒重
Theoretical 1000-grain
weight (g)
灌浆速率方程
Filling rate equation
R2
D1 R1 W=80.01/(1+17.050*EXP(-0.158t)) 80.01 R(t)=215.54EXP(-0.158t)/(1+17.050exp(-0.158t))2 0.995
R2 W=84.18/(1+15.787*EXP(-0.157t)) 84.18 R(t)=208.65EXP(-0.157t)/(1+15.787exp(-0.157t))2 0.997
R3 W=79.51/(1+16.842*EXP(-0.156t)) 79.51 R(t)=208.90EXP(-0.156t)/(1+16.842exp(-0.156t))2 0.996
D2 R1 W=71.46/(1+20.937*EXP(-0.154t)) 71.46 R(t)=230.41EXP(-0.154t)/(1+20.937exp(-0.154t))2 0.997
R2 W=71.59/(1+20.566*EXP(-0.156t)) 71.59 R(t)=225.51EXP(-0.156t)/(1+20.566exp(-0.156t))2 0.997
R3 W=68.35/(1+22.766*EXP(-0.153t)) 68.35 R(t)=238.08EXP(-0.153t)/(1+22.766exp(-0.153t))2 0.998
D3 R1 W=58.82/(1+23.717*EXP(-0.137t)) 58.82 R(t)=191.12EXP(-0.137t)/(1+23.717exp(-0.137t))2 0.998
R2 W=57.19/(1+24.543*EXP(-0.136t)) 57.19 R(t)=190.89EXP(-0.136t)/(1+24.543exp(-0.136t))2 0.998
R3 W=60.48/(1+26.458*EXP(-0.147t)) 60.48 R(t)=235.23EXP(-0.147t)/(1+26.458exp(-0.137t))2 0.998

Fig.1

The dynamic of grain filling under different treatments"

Table 5

The grain filling parameters under different treatments"

参数
Parameter
密度Density 行距Row spacing 变异系数
Coefficient of variation (%)
D1 D2 D3 R1 R2 R3
t1 (d) 9.49 11.32 13.56 11.44 11.15 11.78 14.73
t2 (d) 26.27 28.39 32.39 29.10 28.34 29.60 8.99
t3 (d) 47.14 49.63 55.84 51.10 49.74 51.78 7.47
T1 (d) 9.49 11.32 13.56 11.44 11.15 11.78 14.73
T2 (d) 16.78 17.07 18.84 17.67 17.19 17.82 5.64
T3 (d) 20.88 21.24 23.44 21.99 21.40 22.18 5.64
Tmax(d) 17.88 19.85 22.98 20.27 19.75 20.69 10.57
Rmax [g/(1000-grain·d)] 3.19 2.77 2.06 2.64 2.82 2.55 17.77
T/d 47.14 49.63 55.84 51.09 49.74 51.78 7.47
R [g/(1000-grain·d)] 1.72 1.44 1.06 1.39 1.49 1.34 19.87

Table 6

Path and correlation analysis of disc traits and yield (Y)"

性状
Trait
密度
Density
与产量的相互关系
Correlation with yield
直接作用
Direct effect
间接作用Indirect effect
X1Y X2Y X3Y X4Y X5Y X6Y 合计Total
花盘直径
Disc diameter (X1)
D1 0.579* 0.155 -0.081 0.569 -0.057 -0.003 -0.005 0.423
D2 -0.066 -0.007 -0.009 -0.063 0.037 0.019 -0.044 -0.059
D3 -0.557* -0.004 0.030 -0.209 0.144 -0.185 -0.332 -0.553
花盘重
Disc weight (X2)
D1 0.555* -0.092 0.138 0.573 -0.059 0.000 -0.006 0.647
D2 0.645* 0.020 0.003 0.396 -0.006 -0.151 0.383 0.626
D3 0.831** -0.047 0.003 0.241 -0.114 0.248 0.500 0.878
千粒重
1000-grain weight (X3)
D1 0.883** 0.769** 0.115 -0.068 0.072 -0.002 -0.003 0.114
D2 0.987** 0.565* 0.001 0.014 0.052 -0.236 0.591 0.422
D3 0.909** 0.274 0.003 -0.041 -0.141 0.276 0.538 0.635
盘粒数
Seed number per disc (X4)
D1 0.588* 0.48** -0.018 0.011 0.116 -0.002 0.002 0.108
D2 0.632* 0.101 -0.002 -0.001 0.294 -0.134 0.375 0.532
D3 -0.477* 0.177 -0.003 0.030 -0.219 -0.177 -0.286 -0.655
秕籽率
Rate of aborted seeds (X5)
D1 -0.197 0.014 -0.028 0.001 -0.119 -0.067 0.002 -0.211
D2 -0.960** 0.241* -0.001 -0.012 -0.553 -0.056 -0.580 -1.202
D3 -0.977** -0.290* -0.003 0.040 -0.261 0.108 -0.571 -0.687
盘粒重
Grain weight per disc (X6)
D1 0.092 -0.013 0.058 -0.040 0.162 -0.075 -0.002 0.105
D2 0.999** 0.598* 0.000 0.013 0.559 0.063 -0.234 0.401
D3 0.997** 0.589 0.002 -0.040 0.251 -0.086 0.281 0.408

Table 7

The yield and its components of different treatments"

密度
Density
行距
Row
spacing
产量构成因素Yield components 单株产量
Grain weight
per plant (g)
群体产量
Group yield
(kg/hm2)
花盘数(盘/hm2
Disc number
(disc/hm2)
盘粒数
Seed number
per disc
秕籽率
Rate of aborted
seeds (%)
千粒重
1000-grain
weight (g)
D1 R1 39 907d 1002a 11.19c 78.59a 78.78a 3144bc
R2 39 907d 994a 11.21c 80.81a 80.33a 3206bc
R3 39 824d 1010a 12.15bc 78.60a 79.41a 3163bc
均值 39 879 1002 11.52 79.33 79.51 3171
D2 R1 49 824c 964a 12.27bc 68.82b 66.36c 3307b
R2 49 907c 983a 11.08c 72.92b 71.75b 3581a
R3 49 740c 966a 14.02b 63.37c 61.27d 3048cd
均值 49 824 971 12.46 68.37 66.46 3312
D3 R1 65 994b 872b 17.49a 45.08e 39.02e 2591e
R2 66 161ab 868b 17.55a 45.19e 39.27e 2581e
R3 66 494a 822c 14.27b 51.94d 42.64e 2835d
均值 66 216 854 16.44 47.40 40.31 2669
[1] 赵明, 王树安, 李少昆. 论作物产量研究的“三合结构模式”. 北京农业大学学报, 1995, 21(4):359-363.
[2] 赵发清, 朱必凤, 马海燕. 作物的生长冗余和生命体的节约原则. 生态学杂志, 1996, 15(1):32-34.
[3] 张荣, 孙国钧, 李凤民. 冗余概念的界定与冗余产生的生态学机制. 西北植物学报, 2003, 23(5):844-851.
[4] 谢婷婷, 苏培玺, 周紫鹃, 等. 集群种植方式对棉花田间小气候效应和产量的影响. 西北农业学报, 2014, 23(3):55-61.
[5] 徐新霞, 雷建峰, 高丽丽, 等. 行距配置对机采棉花冠层结构及光合特性的影响. 西北农业学报, 2016, 25(10):1479-1485.
[6] 许伟, 买文选, 赵振勇, 等. 栽培密度对新疆蓖麻产量构成的影响. 干旱区研究, 2016, 33(6):1364-1369.
[7] 朱云集, 郭汝礼, 郭天财, 等. 行距配置与密度对兰考906群体质量及产量的影响. 麦类作物学报, 2001, 21(2):62-66.
[8] 冯银平, 沈海花, 罗永开, 等. 种植密度对苜蓿生长及生物量的影响. 植物生态学报, 2020, 44(3):248-256.
doi: 10.17521/cjpe.2019.0157
[9] 黎磊, 周道玮, 盛连喜. 密度制约决定的植物生物量分配格局. 生态学杂志, 2011, 30(8):1579-1589.
[10] 郭树春, 李素萍, 孙瑞芬, 等. 世界及我国向日葵产业发展总体情况分析. 中国种业, 2021(7):10-13.
[11] 王鹏, 陈寅初, 李万云, 等. 抗当列向日葵品种(系)植物学性状对产量预测模型的影响. 作物杂志, 2016(1):38-45.
[12] 凌一波, 冯云格, 王斌杰, 等. 密度与行距配置对向日葵冠层结构及光合特性的影响. 作物杂志, 2022(3):155-160.
[13] 赵松岭, 李凤民, 张大勇, 等. 作物生产是一个种群过程. 生态学报, 1997, 17(1):100-104.
[14] 余娟娟, 谈建鑫, 王江丽, 等. 种植密度与行距配置对复播油葵同化物转运和产量的影响. 新疆农业科学, 2014, 51(12):2162-2167.
[15] 谢飞, 魏慧, 张凯, 等. 间作时期和种植密度对甜瓜/向日葵间作系统光能利用效率的影响. 中国沙漠, 2015, 35(3):652-657.
doi: 10.7522/j.issn.1000-694X.2014.00061
[16] 赵全志, 高尔明, 黄丕生, 等. 源库质量与作物超高产栽培及育种. 河南农业大学学报, 1999, 22(3):226-230.
[17] 刘星, 张书乐, 刘国峰, 等. 连作对甘肃中部沿黄灌区马铃薯干物质积累和分配的影响. 作物学报, 2014, 40(7):1274-1285.
[18] 张倩, 宋希云, 姜雯. 种植方式和密度对夏玉米子粒灌浆特征的影响. 玉米科学, 2014, 22(3):91-97.
[19] 张静, 张志, 杜彦修, 等. 不同深耘及施穗肥方式对水稻根系活力、籽粒灌浆及产量的影响. 中国农业科学, 2012, 45(19):4115-4122.
doi: 10.3864/j.issn.0578-1752.2012.19.025
[20] 张永强, 方辉, 陈传信, 等. 遮阴和种植密度对冬小麦灌浆特性及籽粒品质的影响. 中国农业大学学报, 2019, 24(5):10-19.
[21] 李豪圣, 宋健民, 刘爱峰, 等. 播期和种植密度对超高产小麦‘济麦22’产量及其构成因素的影响. 中国农学通报, 2011, 27(5):243-248.
[1] Chang Shihao, Geng Zhen, Yang Qingchun, Shu Wentao, Li Jinhua, Li Qiong, Zhang Baoliang, Zhang Donghui. Correlation Analysis of Yield and Agronomic Traits of Summer Soybean Based on BLUP Value [J]. Crops, 2023, 39(5): 10-15.
[2] Yi Bing, Liu Jingang, Song Dianxiu, Wang Dexing, Zhao Mingzhu, Liu Xiaohong, Sun Enyu, Cui Liangji. Study on Land Productivity and Interspecific Competition of Sunflower and Millet Intercropping in Arid Areas [J]. Crops, 2023, 39(5): 219-223.
[3] Zhu Kongyan, Han Shengcai, Zhao Rong, Wen Yujie, Hu Haochi, Qiao Yimin, Lu Jiafeng, Cao Kai, Xu Zhenghan, Bao Haizhu, Gao Julin. Isolation and Identification of Endophytes from Sunflower Seeds [J]. Crops, 2023, 39(5): 280-284.
[4] Li Yuxin, Lu Min, Zhao Jiuran, Wang Ronghuan, Xu Tianjun, Lü Tianfang, Cai Wantao, Zhang Yong, Xue Honghe, Liu Yueʼe. The Production Status Investigation and Analysis of Summer Maize in Beijing-Tianjin-Tangshan Region [J]. Crops, 2023, 39(4): 174-181.
[5] Zhang Guozhong, Li Juan, Li Yucai, Jin Shoulin, Hong Ruke, Huang Dajun, Pu Shihuang, Shi Congbo, Duan Zilin, Ma Di, Chen Lijuan. The Effects of Nitrogen Fertilizer Reduction and Transplanting Density on Yield and Eating Quality of Japonica Hybrid Rice Dianheyou 615 [J]. Crops, 2023, 39(3): 109-115.
[6] Guo Shulei, Wang Ying, Wei Liangming, Zhang Xin, Liu Yan, Wu Weihua, Lu Daowen, Lei Xiaobing, Wang Zhenhua, Lu Xiaomin. Analysis of Influencing Factors of Maize Yield under Different Ecological Conditions [J]. Crops, 2023, 39(3): 205-214.
[7] Ma Jiyu, Wang Shuang, Li Yun, Guo Zhenqing, Wang Jian, Lin Xiaohu, Han Yucui. Effects of Planting Density on Agronomic Characteristics and Yield of Foxtail Millet [J]. Crops, 2023, 39(2): 222-228.
[8] Qiao Jiangfang, Zhang Panpan, Shao Yunhui, Liu Jingbao, Li Chuan, Zhang Meiwei, Huang Lu. Effects of Different Planting Densities and Varieties on Dry Matter Production and Yield Components of Summer Maize [J]. Crops, 2022, 38(6): 186-192.
[9] Chong Haotian, Shang Cheng, Zhang Yunbo, Huang Liying. Effects of Dense Planting with Reduced Nitrogen Application on Spikelet Formation of Different Types of Rice Varieties [J]. Crops, 2022, 38(6): 226-233.
[10] Sun Yunchao, Peng Keyan, Feng Shengye, Ji Chuanyun, Lü peng, Ju Zhengchun. Effects of Row Spacing and Seedling Belt Width on Dry Matter Accumulation and Distribution of Wheat in Wide Refined Sowing [J]. Crops, 2022, 38(5): 130-134.
[11] Jia Xiuping, Mao Xuhui, Liang Gensheng, Liu Runping, Liu Feng, Wang Xingzhen. Analysis of Physiological and Biochemical Mechanism and Growth and Development Characteristics of Saline and Alkali Resistance in Sunflower [J]. Crops, 2022, 38(5): 146-152.
[12] Shi Bixian, Tao Jianfei, Gao Yan, Xie Huihong, Abulimiti·Aierken , Cheng Pingshan, Maitituersun·Sadike , Sha Hong. Effects of Different Planting Densities on the Morphological Traits and Yields of Three Confectionery Sunflower Varieties [J]. Crops, 2022, 38(5): 195-200.
[13] Zhou Wuxian, Li Mengge, Tan Xuhui, Wang Youyuan, Wang Hua, Jiang Xiaogang, Duan Yuanyuan, Zhang Meide. Effects of Sowing Density on Growth, Nutritional Quality and Soil Enzyme Activity of Pinellia ternata in Different Seasons [J]. Crops, 2022, 38(4): 205-213.
[14] Zhou Fei. Bioinformatics and Expression Analysis of HaLACS7 Gene in Sunflower [J]. Crops, 2022, 38(3): 104-108.
[15] Ling Yibo, Feng Yunge, Wang Binjie, Zhang Kai, Chen Nianlai. Effects of Density and Row Spacing on Canopy Structure and Photosynthetic Characteristics in Sunflower [J]. Crops, 2022, 38(3): 155-160.
Viewed
Full text


Abstract

Cited

  Shared   
  Discussed   
No Suggested Reading articles found!