


人类活动导致大气温室气体浓度升高是全球气候变暖的主要驱动因子,其中氧化亚氮(N2O)是第三大温室气体,也是在大气中留存时间最长的温室气体,其百年的全球增温潜势是二氧化碳(CO2)的273倍[1]。全球人为N2O排放量在过去几十年显著增加,其中大部分与作物生产及氮肥施用[2]有关。农业源N2O排放占全球人为N2O排放总量的60%以上,其中农田排放约占30%[3],我国农业源N2O的相应排放占全国人为总排放的70%以上[4]。要在21世纪末将地表平均气温升高幅度控制在1.5℃以下,全球需在2050年前实现温室气体的“净零排放”。因此,在多种CO2减排措施不断涌现的同时,N2O等非CO2温室气体减排也成为国际关注的新焦点[5]。目前全球有超过130个国家设定了实现“净零排放”目标的时限,多集中在2045-2070年[6]。我国于2020年9月在第75届联合国大会上郑重承诺:力争2030年前实现碳达峰,2060年前实现碳中和[7]。虽然我国碳达峰主要是CO2,但碳中和包括非CO2温室气体。在占全球不足9%的耕地和6%的淡水资源等条件下,我国保障了世界约20%人口的粮食供给[8],其中化肥和农药等农用化学品投入发挥了至关重要的作用。截至2018年,我国氮肥用量与1979年相比增长幅度约240%[9]。大量研究[2,10]证明,氮肥不合理施用是导致农田N2O排放增加的主要原因。随着非CO2温室气体减排的国际压力剧增,以及国内农业绿色高质量发展和“碳达峰、碳中和”双碳目标等行动的深入推进,在粮食安全前提下,开展作物生产的农田N2O减排,急需区域针对性强的农田N2O减排策略与技术指导。
虽然关于N2O排放的关键过程、主要机制及其影响因子的研究比较多,但是针对我国不同区域农田N2O排放及针对性减排的综合研究仍不足。在森林生态系统中,有研究[11]发现硝化作用是森林土壤N2O排放的关键来源,并且其排放通量主要与气温相关。曹文超等[12]综合论述了土壤N2O产生的各主要途径及其调控因子对N2O排放的影响,但在减排途径等方面仍探讨不够。也有一些关于农田N2O排放影响因素和减排措施方面的研究,但这些研究多侧重施氮量[13]、秸秆还田方式和生物炭[14]等单一或交互影响因子等方面,在影响因素和减排措施等方面仍梳理不够。另外,关于我国农田N2O排放特征方面,Zou等[15]通过模型模拟加入降水量和氮肥施用量等空间数据库,估算了1980-2000年全国农田N2O的直接排放量;李艳春等[16]估算了福建省农业生态系统N2O排放量,分析了该省排放的年代变化;张凡等[17]分析了西北干旱半干旱地区农田土壤N2O排放空间变化特征,并探讨其影响因素。但是在全国层面,尤其是基于单位作物播种面积的排放特征研究尚缺,不利于农田N2O减排技术途径的科学规划。为此,本文首先分析我国农田氮肥施用的变化趋势,并量化分析我国农田N2O排放的时空特征;之后,在进一步明晰我国农田N2O排放的关键过程及影响因素基础上,提出了我国农田N2O减排策略与途径以及支撑N2O减排的科技与政策创新建议,为我国农田N2O减排的行动方案制定和技术创新提供依据。
1 数据来源与分析方法
1.1 数据来源
关于我国农田N2O排放估算和氮肥施用分析的数据资料主要包括2001-2018年全国各省所有作物播种面积和氮肥施用折纯量等数据,均从国家数据中心(
1.2 计算方法
农田N2O排放等于作物生产过程中的氮输入量乘以其相应的N2O排放因子。计算公式参照《省级温室气体清单编制指南》[19]:
EN2O=∑(N输入×EF)×44/28
表1 各作物种植区N2O排放因子
Table 1
| 省(市、区) Province (municipality and autonomous region) | N2O排放因子 N2O emission factor | 范围 Range |
|---|---|---|
| 内蒙古,新疆,甘肃,青海,西藏,陕西,山西,宁夏 Inner Mongolia, Xinjiang, Gansu, Qinghai, Tibet, Shaanxi, Shanxi, Ningxia | 0.0056 | 0.0015~0.0085 |
| 黑龙江,吉林,辽宁 Heilongjiang, Jilin, Liaoning | 0.0114 | 0.0021~0.0258 |
| 北京,天津,河北,河南,山东 Beijing, Tianjin, Hebei, Henan, Shandong | 0.0057 | 0.0014~0.0081 |
| 浙江,上海,江苏,安徽,江西,湖南,湖北,四川,重庆 Zhejiang, Shanghai, Jiangsu, Anhui, Jiangxi, Hunan, Hubei, Sichuan, Chongqing | 0.0109 | 0.0026~0.0220 |
| 广东,广西,海南,福建 Guangdong, Guangxi, Hainan, Fujian | 0.0178 | 0.0046~0.0228 |
| 云南,贵州 Yunnan, Guizhou | 0.0106 | 0.0025~0.0218 |
1.3 文献收集与分析
为了进一步分析农田土壤N2O排放的关键过程与影响因子,以N2O排放、机制和影响因素等为主题,全面搜集中国知网电子期刊、各类论文和Web of Science在线期刊等资料,综合分析国内外关于农田N2O排放机制和影响因素方面的研究进展。对已收集文献资料进行整理归纳,进一步明确我国农田N2O排放的关键过程、主要影响因子和作用机制,并针对我国区域作物生产的N2O排放特征,制定N2O减排的技术途径与方向。
2 我国农田氮肥施用及N2O排放的时空特征
2.1 农田氮肥施用的时空特征
氮肥施用是影响农田N2O排放高低的最关键因子。从时间上看(图1a),我国农田单位播种面积的氮肥用量在2001-2007年呈明显递增趋势,而后保持相对稳定,2014年后出现下降趋势,但2018年农田单位播种面积的氮肥用量仍高于2001年;各区域的农田单位播种面积氮肥用量达最高点的时间不同,但在2018年均呈下降趋势。在2001-2018年,不同区域农田单位播种面积氮肥用量为华东地区>华北地区>西北地区>西南地区>华南地区>华中地区>东北地区。总体来看,华南地区的上升趋势最明显。在农田氮肥利用现状上(图1b),2018年单位播种面积氮肥用量为华东地区>华北地区>西北地区>华南地区>西南地区>华中地区>东北地区。最高值华东地区的平均单位播种面积氮肥用量达1.43t/hm2,最低值东北地区的平均单位播种面积氮肥用量为0.44t/hm2,相差约3.3倍。
图1
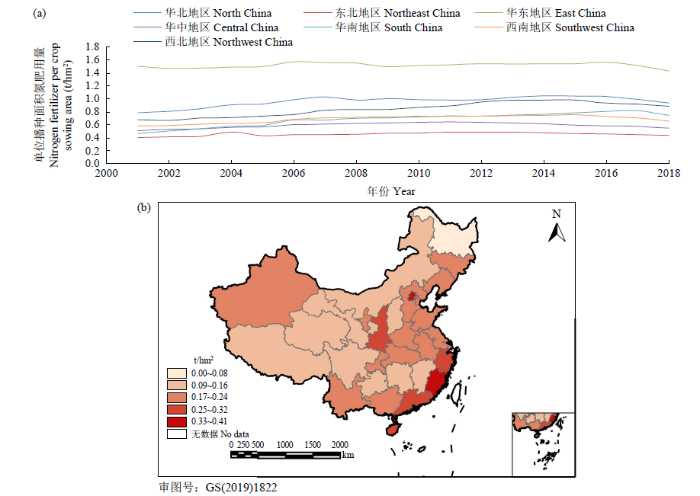
图1
我国农田氮肥施用的时间(a)和空间(b)特征
地图来源于全国地理信息资源目录服务系统(
Fig.1
Temporal (a) and spatial (b) characteristics of N application rate in farmland of China
The map is from the National Geographic Information Resource Directory Service System (
2.2 农田N2O排放的时空特征
进入21世纪以来,我国农田N2O排放一直处于稳定上升状态(图2a)。直到2015年农田N2O排放达到最高点,而后逐渐开始下降,主要原因可能是农业农村部启动的“减肥减药”双减行动在各地区均卓有成效,但2018年农田N2O排放仍高于2001年。除华东地区外,各地区农田N2O排放均呈增长趋势,直到2010或2015年才有所下降,但依旧高于2001年。近年来,华东地区农田N2O排放呈下降趋势,截至2018年其农田N2O排放(与2001年相比)下降约15%。在2001-2018年,不同地区农田N2O排放均为华东地区>华中地区>华南地区>西南地区>东北地区>华北地区>西北地区。2018年单位播种面积N2O排放以华东地区最高,达7.3t CO2-eq/hm2,其他区域高低依次为华南地区、西南地区、华北地区、东北地区和西北地区(图2b),华中地区最低(2.1t CO2-eq/hm2)。不同地区环境条件、作物品种、耕作方式和外界碳氮投入的相互作用,使得农田N2O排放形成南高北低的趋势。
图2

图2
我国农田N2O排放的时间(a)和空间(b)特征
Fig.2
Temporal (a) and spatial (b) characteristics of N2O emission from farmland of China
3 农田N2O排放的关键过程及其主要影响因素
3.1 农田N2O排放的关键过程
图3
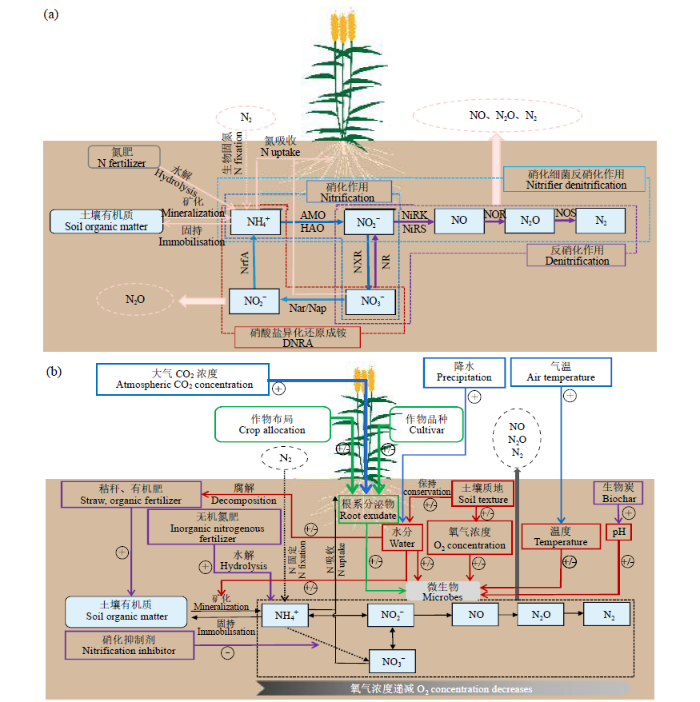
图3
土壤N2O排放的关键过程(a)和主要影响因素(b)
AMO:氨单加氧酶,HAO:羟胺氧化还原酶,NXR:亚硝酸盐氧化还原酶,NR:硝酸盐还原酶,Nar/Nap:硝酸异化还原酶,NrfA:细胞色素C亚硝酸盐还原酶,NiRK:含铜的亚硝酸盐还原酶,NiRS:含有细胞色素cd1的亚硝酸盐还原酶,NOR:NO还原酶,NOS:N2O还原酶,“  ”表示正效应,“
  ”表示负效应,“
  ”表示正效应和负效应并存
Fig.3
Key processes (a) and influencing factors (b) of soil N2O emissions
AMO: ammonia monooxygenase, HAO: hydroxylamine oxidoreductase, NXR: nitrite oxidoreductase, NR: nitrate reductase; Nar/Nap: membrane-bound nitrate reductase/periplasmic nitrate reductase, NrfA: cytochrome C nitrite reductase, NiRK: copper-containing nitrite reductase, NiRS: cytochrome cd1 nitrite reductase, NOR: nitric oxide reductase, NOS: nitrous oxide reductase, “  ” represents a positive effect, “
  ” represents a negative effect, “
  ” represents the coexistence of positive and negative effects
3.2 农田N2O排放的主要影响因素及其作用机制
不同的外界碳氮投入,例如氮肥、秸秆等有机物料添加,对农田温室气体排放存在不同影响。其中,外源氮添加诸如施肥和大气氮沉降等,可快速提高土壤NH4+和NO3–含量,从而显著增加N2O排放[26]。秸秆和有机肥等有机物料添加是提高土壤肥力、促进土壤健康的良好农田管理措施。秸秆施入后主要通过影响土壤碳、氮有效性及土壤通气性进而间接影响土壤N2O排放[27]。多年来在农业生产中,不仅外界有机物料投入增加,作物品种也不断更新换代。生产力和氮吸收能力较强的作物品种可以降低土壤N2O排放,这与土壤中较多的氮被吸收和较少的有效氮可被微生物利用有关[28]。同时作物合理轮作倒茬和保护性耕作等耕作措施也是影响农田N2O排放的重要因子。
土壤特性主要通过影响N2O产生或排放的中间过程进而影响农田N2O排放。土壤水分含量直接影响土壤微生物活性和通气性,进而影响土壤硝化和反硝化过程的进行以及N2O在土壤中的传输和向大气的扩散[29]。土壤pH可直接通过影响微生物活性调控农田N2O排放,在一定范围内,随着pH降低,其活性受到抑制而无法进一步将N2O还原成N2,导致N2O累积增多[30]。土壤温度则主要通过控制土壤有机质的分解和微生物代谢过程中相关酶的活性来影响土壤N2O的产生[29]。氧气(O2)浓度主要通过影响土壤微生物活性而间接影响土壤N2O排放的生物学过程。土壤质地直接影响土壤含水量及含氧量[31],间接影响土壤硝化和反硝化相关的微生物活性,进而影响土壤N2O排放。
大气CO2浓度和气温升高以及极端降水频率增加,是全球气候变化的主要特征,也影响着农田N2O排放。通过模拟大气CO2浓度升高,发现植物生长量和根系分泌物增加,进而影响微生物活性,促进不完全反硝化的增加,提高了N2O:N2排放比,从而促进N2O排放[32]。大气温度及降水主要是通过影响土壤温度和含水量间接影响硝化和反硝化作用等影响农田N2O产生的微生物学过程。
4 我国农田N2O的减排途径分析及行动建议
4.1 农田N2O减排的可行途径
依据农田N2O排放关键过程及其主要影响因素,结合我国农田氮肥施用和N2O排放特征,在选用氮高效利用及低土壤N2O排放的作物品种前提下,我国不同区域农田N2O减排可考虑选用绿色生态施肥技术。诸如配方肥深施、水肥一体化、有机肥或绿肥替代化肥等技术途径,通过氮肥增效或有机替代等措施实现减量施用,显著降低土壤N2O排放。在农田氮肥施用量和N2O排放较高的地区,可依据作物不同生长阶段需肥特性,优化施肥时间与方式。例如,在华东地区,由于作物生长前期需肥量少,可调整N、P、K的施肥比例,分次撒施,以及选用长效氮肥和缓控释肥等,通过科学施肥来提高氮肥利用效率,减少氮素在土壤中的累积,进而降低农田N2O排放[26]。而在华北等蔬菜广泛种植或水分调控程度高的地区,可通过合适的土壤水分以及水肥一体化的管理措施,改变土壤充水孔隙度(WFPS)、土壤通气性和O2浓度等,影响硝化和反硝化菌的活性[33],进而影响土壤N2O排放。已有研究[34]表明,不同灌溉管理措施下,水肥一体化的滴灌(与传统灌溉相比)创造了一个相对稳定的环境,减少了农田N2O排放。与此同时,适宜的作物品种和合理的种植制度与方式也有利于降低农田N2O排放。在适宜的地区,通过种植氮吸收能力较强的作物品种,农田土壤中铵和硝酸盐的供应量减少,降低了N2O生成的底物浓度,有利于降低N2O排放[28]。在作物多熟种植地区,依据作物对自然条件的适应以及当地的社会经济条件,采取粮食作物与绿肥或豆科作物进行合理轮作倒茬,增加豆科作物的布局,减少化学氮肥施用,提高氮肥利用效率,降低温室气体排放[35]。在作物合理配置的基础上,实施保护性耕作(尤其针对土壤退化严重的地区)也是降低农田N2O排放的途径之一。已有研究[36]表明,保护性耕作与常规耕作相比,有助于改善土壤结构、增加土壤碳储量和提高土壤生产力,进而减少农田N2O排放。由于稻田是甲烷(CH4)产生和排放的重要源,在降低农田N2O排放的同时不能以增加CH4排放为代价,应考虑减排技术的综合温室效应。
在考虑作物品种和耕作栽培技术等的同时,一些减排产品,诸如硝化抑制剂和生物炭等也可以起到明显的N2O减排效果。其中施用硝化抑制剂,可以直接抑制土壤中NH4+向NO3–的转化,从而抑制土壤微生物硝化和反硝化过程产生的N2O[37]。目前常用的硝化抑制剂包括双氰铵和3,4-二甲基吡唑等。外施生物炭不仅可以显著提高土壤固碳量[38],而且可通过改变土壤物理、化学以及生物学性质影响农田N2O的排放。如生物炭通常具有高C/N比,并含有小分子量有机化合物,其多孔的结构适宜微生物生长并有利于土壤氮素的固定,进而减少氮素有效性,降低土壤N2O的排放。另外,生物炭具有碱性特性,可用来改良酸性土壤,提高土壤pH,抑制土壤N2O的产生,降低其排放[39]。
4.2 农田N2O减排的行动建议
考虑到农田排放的非点源性,且存在持久性、不确定性和精准监测难等问题,需发展简单易行且适用范围更广的农田减排理论和技术,创制更为完整的监测评价体系,以及建立农田减排相关的政策法律法规。同时,要加强科普宣传,政府进行适度干预,推出可持续的碳减排激励和碳排放约束措施的同时,激励社会多元主体参与,共同促进碳减排。科技和经营方式等需要创新,在粮食安全的前提下,完善农田N2O减排技术措施,构建相对简单易行的减排行动方案,提高小农户的绿色低碳意识和组织化程度,发展绿色低碳作物生产模式[40]。另外,创新智慧农业技术,提高农业气象灾害预报预警,提升作物生产系统的气候韧性,完善计量、监测和评估方法,也可以助力农田N2O减排行动。
5 小结
农田N2O受多种环境因素影响,但反硝化作用是影响农田N2O排放最主要的生物学过程。我国自2001年开始,单位播种面积氮肥用量和农田N2O排放量均呈上升趋势,分别于2014和2015年开始下降,其中,华东地区的单位播种面积氮肥用量一直处于最高水平。氮肥施用是影响农田N2O排放最关键的因子,因此,施肥量最高的地区农田N2O排放量也高,例如华东地区。这些地区可选择调整氮肥施用比例、时间以及施用缓控释肥等,达到降低农田N2O排放目的。不同地区农田N2O排放各异,主要受气候、地理和生产技术等影响,应选用适宜的绿色生态施肥等N2O减排措施,包括利用水肥一体化的滴灌方式调控土壤水分、选择低排放作物品种、与豆科绿肥作物等轮作或休耕等保护性耕作,以及水肥一体化和配方肥深施等化肥增效减量技术。稻田N2O排放不能以增加CH4排放为代价,要实施综合减排措施。
不同区域因作物种类和施肥现状不同,应采取相应的化肥增效或替代减量的减排原则。东北地区的重点是控氮、减磷及稳钾,并补充微量元素肥料,开展粮豆轮作,推广水肥一体化和高效缓控释肥等;黄淮海地区的重点同样是减氮、控磷和稳钾,补充中微量元素,采用种肥同播、机械化深施和水肥一体化等措施;长江中下游及南方稻作区要适当减氮、控磷和稳钾,并配合施用硫、锌和硼等中微量元素,推广配方肥、有机肥替代和冬季种植绿肥等措施,并利用钙镁磷肥、石灰和硅钙等碱性调理剂改良酸化土壤;西南地区注意稳氮、调磷和补钾,配合施用硼、钼、镁、硫、锌和钙等中微量元素,以及秸秆还田、沼肥及畜禽粪便合理利用、冬季种植绿肥等措施;西北地区的增效减量施肥原则是以水定肥、以肥调水,稳氮、稳磷、调钾的同时,配合施用锌和硼等中微量元素,实施保护性耕作、秸秆还田和水肥一体化等措施[41]。
参考文献
A comprehensive quantification of global nitrous oxide sources and sinks
DOI:10.1038/s41586-020-2780-0 URL [本文引用: 3]
Data-driven estimates of fertilizer-induced soil NH3,NO and N2O emissions from croplands in China and their climate change impacts
DOI:10.1111/gcb.15975 URL [本文引用: 1]
Soil N2O emissions under conventional tillage conditions and from forest soil
DOI:10.1016/j.still.2019.03.002
[本文引用: 1]

The paper presents the relts of a study aimed at assessing N2O-N emissions from arable and forest soils under the climate conditions of Central Poland. Measurements were conducted during the 2012 growing season. N2O-N emissions from the soil were measured in situ by infrared spectroscopy using a portable Alpha FTIR spectrometer (Bruker). The measured N2O-N fluxes showed a high variability over the study period, with fluxes from the arable soil treated with fertilizer (0.08-21.60, median 5.31, mean 7.08 mu g N2O-N m(-2) h(-1)) tending to exceed those from the forest soil (0.00-18.78, median 3.35, mean 4.54 mu g N2O-N m(-2) h(-1)). N2O-N fluxes from the arable soil were correlated stronger with the atmospheric temperature and soil moisture than with the soil NO3-N content. The N2O-N fluxes from the forest soil were positively correlated with atmospheric temperature only. The relationship between the N2O-N emission from the arable soil and soil NH4+-N content was marked by negative correlation. Based on the measured N2O-N flux and its relationship with environmental factors (especially the negative correlation between N2O-N flux and NH4+-N content) it can be hypothesized that de nitrification is an important source of N2O-N in arable soils of Central Poland, even when the soil water-filled pore space (WFPS) during the growing season is below 40%. However, in such soil moisture conditions the N2O-N fluxes from the arable soils are relatively low. The very low soil NO3-N content throughout almost the entire growing season suggests that nitrification may be the main process producing N2O-N in the forest soil characterized a low soil pH. The study results indicate that conservation and sustainable management of forests constitute an effective way to mitigate the N2O-N emissions from the soil. Given the non-zero emission from the forest soils, we postulate a review of the algorithms employed for the approximation of the regional N2O-N emissions to properly reflect the impact of afforestation on the regional N2O-N emission.
Estimates of synthetic fertilizer N-induced direct nitrous oxide emission from Chinese croplands during 1980-2000
DOI:10.1016/j.envpol.2009.08.026 URL [本文引用: 1]
Spatially explicit estimates of N2O emissions from croplands suggest climate mitigation opportunities from improved fertilizer management
DOI:10.1111/gcb.13341
PMID:27185532
[本文引用: 1]
With increasing nitrogen (N) application to croplands required to support growing food demand, mitigating N2 O emissions from agricultural soils is a global challenge. National greenhouse gas emissions accounting typically estimates N2 O emissions at the country scale by aggregating all crops, under the assumption that N2 O emissions are linearly related to N application. However, field studies and meta-analyses indicate a nonlinear relationship, in which N2 O emissions are relatively greater at higher N application rates. Here, we apply a super-linear emissions response model to crop-specific, spatially explicit synthetic N fertilizer and manure N inputs to provide subnational accounting of global N2 O emissions from croplands. We estimate 0.66 Tg of N2 O-N direct global emissions circa 2000, with 50% of emissions concentrated in 13% of harvested area. Compared to estimates from the IPCC Tier 1 linear model, our updated N2 O emissions range from 20% to 40% lower throughout sub-Saharan Africa and Eastern Europe, to >120% greater in some Western European countries. At low N application rates, the weak nonlinear response of N2 O emissions suggests that relatively large increases in N fertilizer application would generate relatively small increases in N2 O emissions. As aggregated fertilizer data generate underestimation bias in nonlinear models, high-resolution N application data are critical to support accurate N2 O emissions estimates.© 2016 John Wiley & Sons Ltd.
Mitigating release of the potent greenhouse gas N2O from the nitrogen cycle could enzymic regulation hold the key?
DOI:10.1016/j.tibtech.2009.03.009
PMID:19497629
[本文引用: 1]
When faced with a shortage of oxygen, many bacterial species use nitrate to support respiration via the process of denitrification. This takes place extensively in nitrogen-rich soils and generates the gaseous products nitric oxide (NO), nitrous oxide (N(2)O) and dinitrogen (N(2)). The denitrifying bacteria protect themselves from the endogenous cytotoxic NO produced by converting it to N(2)O, which can be released into the atmosphere. However, N(2)O is a potent greenhouse gas and hence the activity of the enzyme that breaks down N(2)O has a crucial role in restricting its atmospheric levels. Here, we review the current understanding of the process by which N(2)O is produced and destroyed and discuss the potential for feeding this into new approaches for combating N(2)O release.
Nitrous oxide emissions in agricultural soils: a review
DOI:10.1590/S1983-40632013000300014 URL [本文引用: 1]
A novel dual-isotope labelling method for distinguishing between soil sources of N2O
We present a novel 18O-15N-enrichment method for the distinction between nitrous oxide (N2O) from nitrification, nitrifier denitrification and denitrification based on a method with single- and double-15N-labelled ammonium nitrate. We added a new treatment with 18O-labelled water to quantify N2O from nitrifier denitrification. The theory behind this is that ammonia oxidisers use oxygen (O2) from soil air for the oxidation of ammonia (NH3), but use H2O for the oxidation of the resulting hydroxylamine (NH2OH) to nitrite (NO2-). Thus, N2O from nitrification would therefore be expected to reflect the 18O signature of soil O2, whereas the 18O signature of N2O from nitrifier denitrification would reflect that of both soil O2 and H2O. It was assumed that (a) there would be no preferential removal of 18O or 16O during nitrifier denitrification or denitrification, (b) the 18O signature of the applied 18O-labelled water would remain constant over the experimental period, and (c) any O exchange between H(2)18O and NO3- would be negligible under the chosen experimental conditions. These assumptions were tested and validated for a silt loam soil at 50% water-filled pore space (WFPS) following application of 400 mg N kg-1 dry soil. We compared the results of our new method with those of a conventional inhibition method using 0.02% v/v acetylene (C2H2) and 80% v/v O2 in helium. Both the 18O-15N-enrichment and inhibitor methods identified nitrifier denitrification to be a major source of N2O, accounting for 44 and 40%, respectively, of N2O production over 24 h. However, compared to our 18O-15N-method, the inhibitor method overestimated the contribution from nitrification at the expense of denitrification, probably due to incomplete inhibition of nitrifier denitrification and denitrification by large concentrations of O2 and a negative effect of C2H2 on denitrification. We consider our new 18O-15N-enrichment method to be more reliable than the use of inhibitors; it enables the distinction between more soil sources of N2O than was previously possible and has provided the first direct evidence of the significance of nitrifier denitrification as a source of N2O in fertilised arable soil.Copyright (c) 2005 John Wiley & Sons, Ltd.
The environmental controls that govern the end product of bacterial nitrate respiration
DOI:10.1126/science.1254070 URL [本文引用: 1]
Increased greenhouse gas emissions intensity of major croplands in China: Implications for food security and climate change mitigation
DOI:10.1111/gcb.15290 URL [本文引用: 3]
Soil nitrous oxide emissions following crop residue addition: a meta-analysis
DOI:10.1111/gcb.12274 URL [本文引用: 1]
Less N2O emission from newly high-yielding cultivars of winter wheat
DOI:10.1016/j.agee.2021.107557 URL [本文引用: 2]
Terrestrial N2O emissions and related functional genes under climate change: A global meta-analysis
DOI:10.1111/gcb.14847 URL [本文引用: 2]
Soil pH as the chief modifier for regional nitrous oxide emissions: New evidence and implications for global estimates and mitigation
DOI:10.1111/gcb.13816 URL [本文引用: 1]
Effects of elevated carbon dioxide concentration on nitrous oxide emissions and nitrogen dynamics in a winter-wheat cropping system in northern China
DOI:10.1007/s11027-013-9513-8 URL [本文引用: 1]
Variations and controlling factors of soil denitrification rate
DOI:10.1111/gcb.16066 URL [本文引用: 1]
N2O emissions and source partitioning using stable isotopes under furrow and drip irrigation in vegetable field of North China
DOI:10.1016/j.scitotenv.2019.02.053 URL [本文引用: 1]
Soil carbon and nitrogen changes after 28 years of no-tillage management under Mediterranean conditions
DOI:10.1016/j.eja.2016.02.011 URL [本文引用: 1]
Direct N2O emissions from rice paddy fields: summary of available data
Biochar in climate change mitigation
DOI:10.1038/s41561-021-00852-8 URL [本文引用: 1]
Biochar application as a tool to decrease soil nitrogen losses (NH3 volatilization, N2O emissions, and N leaching) from croplands: Options and mitigation strength in a global perspective
DOI:10.1111/gcb.14613
PMID:30844112
[本文引用: 1]
Biochar application to croplands has been proposed as a potential strategy to decrease losses of soil-reactive nitrogen (N) to the air and water. However, the extent and spatial variability of biochar function at the global level are still unclear. Using Random Forest regression modelling of machine learning based on data compiled from the literature, we mapped the impacts of different biochar types (derived from wood, straw, or manure), and their interactions with biochar application rates, soil properties, and environmental factors, on soil N losses (NH volatilization, N O emissions, and N leaching) and crop productivity. The results show that a suitable distribution of biochar across global croplands (i.e., one application of <40 t ha wood biochar for poorly buffered soils, such as those characterized by soil pH<5, organic carbon<1%, or clay>30%; and one application of <80 t ha wood biochar, <40 t ha straw biochar, or <10 t ha manure biochar for other soils) could achieve an increase in global crop yields by 222-766 Tg yr (4%-16% increase), a mitigation of cropland N O emissions by 0.19-0.88 Tg N yr (6%-30% decrease), a decline of cropland N leaching by 3.9-9.2 Tg N yr (12%-29% decrease), but also a fluctuation of cropland NH volatilization by -1.9-4.7 Tg N yr (-12%-31% change). The decreased sum of the three major reactive N losses amount to 1.7-9.4 Tg N yr, which corresponds to 3%-14% of the global cropland total N loss. Biochar generally has a larger potential for decreasing soil N losses but with less benefits to crop production in temperate regions than in tropical regions.© 2019 John Wiley & Sons Ltd.
