


苦参(Sophora flavescens Ait.)为豆科槐属(Sophora)多年生落叶亚灌木或多年生草本植物[1],以根入药,味苦性寒,有抑菌、抗病毒和抗肿瘤等多种药理活性[2-3]。苦参作为一种具有广泛应用价值的药用植物,其生产和栽培备受重视。目前,人工栽培苦参技术已经广泛投入种植和生产中。但各地对苦参资源的开发利用和应用范围存在较大差异,人工栽培技术也存在较大的问题,对苦参种质资源和重要农艺性状的相关基础研究较少,致使育种进程缓慢,产量与品质不佳。为解决这一问题,急需对苦参种质资源进行收集和研究,并从中选择优质和可高效利用的种质资源,用于苦参大规模的人工栽培,以满足市场对苦参的需求。
种质资源遗传多样性可通过表型性状或者分子标记等多种方法进行评价,但是表型性状极易受到外界环境的影响,从而导致分析结果缺乏稳定性[4]。分子标记可以在DNA水平上揭示植物的遗传变异,是一种稳定可靠的遗传分析方法[5]。简单重复序列(simple sequence repeats,SSR)分子标记是一种建立在DNA序列多态性基础上的遗传标记,是在DNA分子水平上遗传多态性的直接反映,具有重复性好、多态性高及稳定性强等优点,是育种研究中重要的遗传标记方法之一[6],广泛用于药用植物品种图谱构建、种质资源评价与鉴定、种群遗传多样性分析、基因组作图、基因定位、辅助育种和亲缘关系鉴定等领域,也是分子系统学的重要研究手段[7⇓-9]。
近年来,随着测序技术的不断发展,对叶绿体基因组的研究更加深入,并且取得了长足的进展。叶绿体基因组的结构较核基因组简单,筛选低拷贝的基因较容易,高度保守,母系遗传,不会受基因重组的干扰[10],进化路线相对独立,它在植物遗传多样性[11]、系统发育与进化[12]、物种鉴定及分类学等研究中应用广泛[13-14]。如今有很多分子标记技术(如SSR、SNP和InDel等)都被运用到叶绿体DNA的研究上,形成了基于叶绿体基因组开发的、广泛应用于植物的分子标记技术[15-16]。叶绿体SSR(chloroplast simple sequence repeat,cpSSR)分子标记是其中应用较为广泛的一种。cpSSR具有SSR分子标记技术重复性好、多态性高和稳定性强的优点,同时兼有叶绿体基因组高度保守、单亲遗传、进化相对独立及对DNA样品质量要求不高等优点[17⇓-19]。目前cpSSR已被广泛应用到植物种群遗传多样性[20]、种群结构分析[21]、种群分类[22]和系统地理分布[23]等方面研究。因此本试验基于本课题组报道的苦参叶绿体基因组开发cpSSR分子标记,为苦参种质资源提供鉴定方法,为优异种质资源的有效利用以及突破性新品种和新材料的创制提供材料基础。
本试验以收集到的150份苦参种质资源为材料,并利用前期叶绿体基因组研究中开发的cpSSR标记为基础,对150份苦参种质材料进行遗传结构和多样性分析,以期为苦参种质资源利用及优良品种选育等提供一定的理论基础。
1 材料与方法
1.1 种质材料与DNA提取
表1 苦参的来源信息
Table 1
| 种质Germplasm | 来源Source | 经度Longitude (E) | 纬度Latitude (N) | 海拔Altitude (m) | 样本量Sample |
|---|---|---|---|---|---|
| HD | 河北省邯郸市 | 114°03′~114°40′ | 36°20′~36°44′ | 1899 | 10 |
| THP | 山西省武乡县土河坪村 | 112°26′~113°22′ | 36°39′~37°08′ | 1069 | 10 |
| XHD | 山西省武乡县西河底镇 | 112°26′~113°22′ | 36°39′~37°08′ | 1069 | 10 |
| AG | 河北省安国市 | 115°33′ | 38°42′ | 32 | 10 |
| WGS | 山西省长治市五谷山村 | 113°01′~113°40′ | 35°50′~37°08′ | 976 | 10 |
| CF | 内蒙古赤峰市 | 116°21′~120°58′ | 41°17′~45°24′ | 1000 | 10 |
| TG | 山西省太谷区 | 112°28′~113°01′ | 37°03′~37°12′ | 808 | 10 |
| BJ | 陕西省宝鸡市 | 106°18′~108°03′ | 33°35′~35°06′ | 618 | 10 |
| YL | 陕西省榆林市 | 109°77′ | 38°03′ | 1000 | 10 |
| PY | 山东省平邑县 | 117°37′ | 35°30′ | 146 | 10 |
| LY | 山东省临沂市 | 117°24′~119°11′ | 34°22′~36°13′ | 88 | 10 |
| LNJZ | 辽宁省锦州市 | 121°51′ | 41°31′ | 23 | 10 |
| BZ | 安徽省亳州市 | 115°53′~116°49′ | 32°51′~35°05′ | 35 | 10 |
| SY | 江苏省沭阳县 | 118°30′~119°10′ | 33°53′~34°25′ | 5 | 10 |
| HNJZ | 河南省焦作市 | 113°26′~113°40′ | 35°10′~35°21′ | 91 | 10 |
1.2 苦参叶绿体基因组SSR引物筛选
表2 cpSSR引物信息
Table 2
| 引物名称 Primer name | 正向序列 Forward sequence (5′-3′) | 反向序列 Reverse sequence (5′-3′) | 产物长度 Product length (bp) | 退火温度 Annealing temperature (℃) |
|---|---|---|---|---|
| KS1 | AAACCGACACGGATTACTCG | CCCAATGTACCCTGATACGG | 271 | 54.8 |
| KS2 | CCCCCAATCCTTCTTTGATT | ATTGGCTGTTCGTCAATTCC | 227 | 52.1 |
| KS3 | ATGAGGTTGTGAATCCGAGG | CGATTCGATAAACGGCTCAT | 246 | 54.5 |
| KS4 | ACAGGATTTGAACCCGTGAC | CCTTCCTTATAATTTCATATCCTTCC | 223 | 55.2 |
| KS5 | ACCTTCCCGGAGACTGAACT | AAAGCTTTTGTTTCGGCTCA | 276 | 58.2 |
| KS6 | TCCAATAACCATCCTTCCCTT | GAGTTTTCACACCGGAAAGC | 213 | 52.9 |
| KS7 | ACTCCTTTGATGGGTGTTGC | ACAAAGAAATTCCACGGTCG | 228 | 55.5 |
| KS8 | GGAGCACGGAATATCGAAAA | CCAGAACCACGATGATTGAA | 194 | 52.3 |
| KS9 | AACAGGCTCCGTAAGATCCA | CATCTCAGACCTTGCGATTG | 268 | 55.7 |
| KS10 | GCCTACGGATCAATCGACAT | TGACCACGAAAGTCAAAATGA | 229 | 54.5 |
| KS11 | TTTTCACCTCATACGGCTCC | TGGTTATATATGGATTGCTAAAATTG | 225 | 54.7 |
| KS12 | TTGATGCCTTGATCGAATGA | TGAGCCAGGATCGAACTCTC | 229 | 51.1 |
| KS13 | GAATCGACAGATCCACCGAC | GAATCGACAGATCCACCGAC | 250 | 55.6 |
| KS14 | TGAACTAATTGATTTGATTATTTTCCA | TTTGGAACTGCCATCCAACT | 206 | 47.9 |
| KS15 | TCAAGGGGTTCTCACAAACA | ATTCTCGGTTGACAGGGTTG | 145 | 53.6 |
| KS16 | AGAAGATTAAGGAACCCCCG | GCATGAAACAACTCGAAGCA | 245 | 54.0 |
| KS17 | CCGTGGGACTTAAGGAATGA | CTCAAAGCAAAGCCAAGGAG | 246 | 54.2 |
| KS18 | GGGGGAAACGGATACTCAAT | TTCTTCTGCAGTACCTCGCC | 270 | 54.3 |
1.3 目的产物的扩增及检测
对提取的苦参DNA样品进行稀释,统一稀释为100ng/μL浓度,进行PCR扩增,PCR反应体系10μL,其中苦参DNA模板1μL,2×Es Taq MasterMix 5μL,正向引物0.5μL,反向引物0.5μL,ddH2O 3μL。PCR扩增反应程序参数为94℃预变性2min;94℃变性30s,55℃退火30s,72℃延伸30s,共32个循环;最后72℃终延伸2min确保扩增完整。PCR扩增结束后,检测PCR产物的完整性、质量和浓度,产物于4℃保存备用。
1.4 苦参叶绿体基因组SSR的毛细管电泳分析
将PCR产物浓度稀释到0~50ng/μL范围内,利用岛津DNA/RNA分析专用微芯片电泳仪MCE- 202 MultiNA进行毛细管电泳分析。电泳结果在MultiNA Viewer软件中进行可视化处理,从中获得每个产物的条带片段大小,并进行统计。
1.5 SSR数据统计
利用GenAlEx 6.503[27]对18对cpSSR引物和150份苦参种质资源的遗传多样性和遗传分化进行分析,获得遗传多样性指数:等位基因数(number of alelle,Na)、有效等位基因数(number of effective aelle,Ne)、Shannon's信息指数(shannon's information index,I)、多样性指数(diversity index,h)和无偏多样性指数(unbiased diversity index,uh);利用GenAlEx 6.503进行居群分子方差分析(analysis of molecular variance,AMOVA),分析种质内和种质间的遗传变异分布,并对150份苦参材料进行主坐标分析(principal coordinate analysis,PCoA),进一步评估和聚类。利用Power Marker软件[28]分析SSR位点的多态信息含量(polymorphic information content,PIC),计算150个苦参个体间的Nei's遗传距离,并基于Nei's遗传距离在MEGA X[29]构建UPGMA聚类树[30]。利用STRUCTURE V2.3.4软件[31]分析群体遗传结构,推测最佳群体数目,其中将群体数目(K)设为1~10,对每个K值模拟运算10次,MCMC值分别设为10 000和100 000次,将分析结果转入在线网站Structure Harvester(
2 结果与分析
2.1 苦参基因组DNA扩增产物多态性分析
以150份不同苦参DNA为模板,利用18对cpSSR引物进行PCR扩增,PCR产物统一进行稀释,之后进行毛细管电泳检测,利用MultiNA Viewer软件对运行结果进行分析,记录每个条带大小,第1次未检测到相应结果的进行第2次补充试验,确保结果准确可靠。试验扩增结果如表3所示,18对cpSSR引物共扩增出311个条带,各个引物扩增条带数的范围是9~26,平均每个引物的扩增条带数为17.28。其中,引物KS5扩增出的条带数最多,共26个,而引物KS17扩增条带数最少,共9个。综合分析,18对cpSSR引物的特异性、多态性以及扩增效率均表现良好。
表3 cpSSR扩增条带大小信息
Table 3
| 引物名称 Primer name | 扩增条带数 Number of amplified bands | 扩增条带大小 Amplified band size (bp) |
|---|---|---|
| KS1 | 22 | 244、247、248、249、250、251、253、262、263、264、265、266、267、268、269、270、271、272、273、274、276、278 |
| KS2 | 11 | 224、225、226、227、228、229、230、231、236、237、238 |
| KS3 | 17 | 240、242、243、244、245、246、247、248、249、250、251、252、253、254、255、256、257 |
| KS4 | 25 | 205、206、207、208、209、211、212、213、214、215、216、217、218、219、220、221、222、223、224、231、233、234、235、236、237 |
| KS5 | 26 | 250、256、257、258、259、260、261、262、263、264、265、267、268、269、270、271、272、273、274、275、276、277、278、279、280、281 |
| KS6 | 13 | 207、208、209、210、211、212、213、214、215、216、217、218、219 |
| KS7 | 18 | 218、219、220、221、222、223、224、225、226、227、228、229、230、231、232、233、234、236 |
| KS8 | 24 | 197、198、199、200、287、294、295、296、297、298、299、300、301、302、303、305、306、307、308、309、310、311、312、313 |
| KS9 | 17 | 256、257、258、259、260、261、262、263、264、265、266、267、268、269、270、271、272 |
| KS10 | 25 | 202、203、204、205、206、207、208、209、210、211、212、213、214、215、216、217、218、219、220、221、222、223、224、225、226 |
| KS11 | 15 | 190、191、192、193、194、195、196、197、198、199、220、221、222、223、224 |
| KS12 | 12 | 227、228、229、230、231、232、233、234、235、237、238、239 |
| KS13 | 13 | 251、252、253、254、255、256、257、258、259、260、261、262、264 |
| KS14 | 18 | 197、198、199、200、201、202、203、204、205、206、207、208、209、210、211、212、213、215 |
| KS15 | 22 | 128、129、130、131、132、133、134、135、136、137、138、139、140、141、142、143、144、145、146、169、170、172 |
| KS16 | 13 | 238、239、240、241、242、243、244、245、246、247、248、249、250 |
| KS17 | 9 | 242、243、244、245、246、247、248、249、250 |
| KS18 | 11 | 268、269、270、271、272、273、274、275、276、277、278 |
| 总数Total | 311 | |
| 平均Mean | 17.28 |
2.2 苦参cpSSR引物遗传多样性分析
表4表明,18对引物的PIC值范围在0.803~ 0.940,表明这18对cpSSR引物表现高度多态性。其中PIC最小的为引物KS2,最高的为引物KS10。所有引物的Na为3.667(KS15)~6.400(KS1),Na越大表明引物的多态性越丰富,引物KS1的多态性最丰富,引物KS6、KS7和KS10的多态性仅次于KS1;Ne在2.887(KS15)~5.320(KS10);I范围为1.120(KS15)~1.739(KS1);h范围为0.620(KS15)~0.807(KS6),而所有引物uh的范围为0.691(KS15)~0.898(KS6)。以上多个遗传多样性信息结果表明,本试验所用的18对cpSSR引物具有高度多态性,同时,综合多个遗传多样性指数的结果可发现,引物KS15的多态性最低,而引物KS1、KS6和KS10的多态性较高。
表4 苦参cpSSR位点的遗传多样性
Table 4
| 引物名称Primer name | Na | Ne | I | h | uh | PIC |
|---|---|---|---|---|---|---|
| KS1 | 6.400 | 5.308 | 1.739 | 0.801 | 0.890 | 0.915 |
| KS2 | 4.200 | 3.405 | 1.281 | 0.685 | 0.761 | 0.803 |
| KS3 | 5.867 | 4.639 | 1.625 | 0.773 | 0.860 | 0.890 |
| KS4 | 6.200 | 5.155 | 1.690 | 0.787 | 0.874 | 0.917 |
| KS5 | 6.000 | 5.093 | 1.625 | 0.749 | 0.833 | 0.931 |
| KS6 | 6.267 | 5.290 | 1.738 | 0.807 | 0.898 | 0.897 |
| KS7 | 6.267 | 5.112 | 1.712 | 0.793 | 0.881 | 0.888 |
| KS8 | 5.133 | 4.040 | 1.483 | 0.737 | 0.819 | 0.921 |
| KS9 | 5.067 | 4.041 | 1.462 | 0.731 | 0.812 | 0.907 |
| KS10 | 6.267 | 5.320 | 1.730 | 0.804 | 0.893 | 0.940 |
| KS11 | 4.133 | 3.203 | 1.259 | 0.675 | 0.750 | 0.837 |
| KS12 | 4.667 | 3.546 | 1.356 | 0.698 | 0.777 | 0.825 |
| KS13 | 5.467 | 4.432 | 1.559 | 0.761 | 0.846 | 0.858 |
| KS14 | 5.467 | 4.281 | 1.538 | 0.748 | 0.831 | 0.898 |
| KS15 | 3.667 | 2.887 | 1.120 | 0.620 | 0.691 | 0.928 |
| KS16 | 5.333 | 4.248 | 1.532 | 0.753 | 0.840 | 0.862 |
| KS17 | 5.267 | 4.181 | 1.526 | 0.755 | 0.840 | 0.860 |
| KS18 | 5.800 | 4.936 | 1.663 | 0.793 | 0.881 | 0.875 |
| 平均Mean | 5.415 | 4.395 | 1.535 | 0.748 | 0.832 | 0.886 |
2.3 不同种质苦参遗传多样性分析
利用GenAlEx 6.503软件对苦参种质进行遗传多样性分析,结果如表5所示,不同种质苦参的遗传多样性存在差异,Na平均值为5.415;Ne平均值为4.395,Ne最高的种质为山西武乡土河坪村(THP);I值最高的种质为山西武乡土河坪村(THP),最低的为河北安国(AG),分别是1.600和1.426;h表明15个种质中山西武乡土河坪村(THP)的多样性最高,为0.769,而安徽亳州(BZ)的多样性最低,为0.713;所有种质的uh最高是河北邯郸(HD),为0.874,山西武乡土河坪村(THP)的uh次之,为0.855。由以上多个遗传多样性参数可以看出,150份不同种质苦参均具有较高的遗传多样性,其中山西武乡土河坪村(THP)的种质遗传多样性参数值表现较高,表明该种质苦参的遗传多样性更加丰富。
表5 15个不同种质苦参的遗传多样性
Table 5
| 种质Germplasm | Na | Ne | I | h | uh |
|---|---|---|---|---|---|
| HD | 5.500 | 4.542 | 1.567 | 0.761 | 0.874 |
| THP | 5.667 | 4.786 | 1.600 | 0.769 | 0.855 |
| XHD | 5.167 | 4.096 | 1.470 | 0.726 | 0.806 |
| AG | 5.000 | 3.872 | 1.426 | 0.714 | 0.794 |
| WGS | 5.167 | 4.076 | 1.483 | 0.737 | 0.819 |
| CF | 5.444 | 4.387 | 1.556 | 0.759 | 0.844 |
| TG | 5.500 | 4.540 | 1.566 | 0.761 | 0.847 |
| BJ | 5.833 | 4.629 | 1.591 | 0.753 | 0.839 |
| YL | 5.556 | 4.573 | 1.565 | 0.754 | 0.838 |
| PY | 5.333 | 4.385 | 1.542 | 0.759 | 0.843 |
| LY | 5.278 | 4.329 | 1.502 | 0.739 | 0.823 |
| LNJZ | 5.556 | 4.580 | 1.584 | 0.768 | 0.853 |
| BZ | 5.278 | 4.421 | 1.475 | 0.713 | 0.793 |
| SY | 5.500 | 4.405 | 1.552 | 0.753 | 0.837 |
| HNJZ | 5.444 | 4.310 | 1.555 | 0.760 | 0.845 |
| 平均Mean | 5.415 | 4.395 | 1.535 | 0.748 | 0.832 |
2.4 不同种质苦参AMOVA分析
如表6所示,15个种质间的遗传变异率为8%,种质内的遗传变异率为92%,种质内的遗传变异远大于种质间,表明15个苦参种质资源的遗传变异主要发生在种质内。
表6 苦参种质AMOVA分析
Table 6
| 项目Item | 自由度df | 平方和SS | 均方MS | 估计方差Estimated variance | 遗传变异率Genetic variation rate (%) |
|---|---|---|---|---|---|
| 种质间Inter germplasms | 14 | 785.573 | 56.112 | 2.611 | 8 |
| 种质内Within germplasms | 135 | 4049.900 | 29.999 | 29.999 | 92 |
| 总计Total | 149 | 4835.473 | - | 32.610 | 100 |
2.5 不同种质苦参遗传结构分析
图1
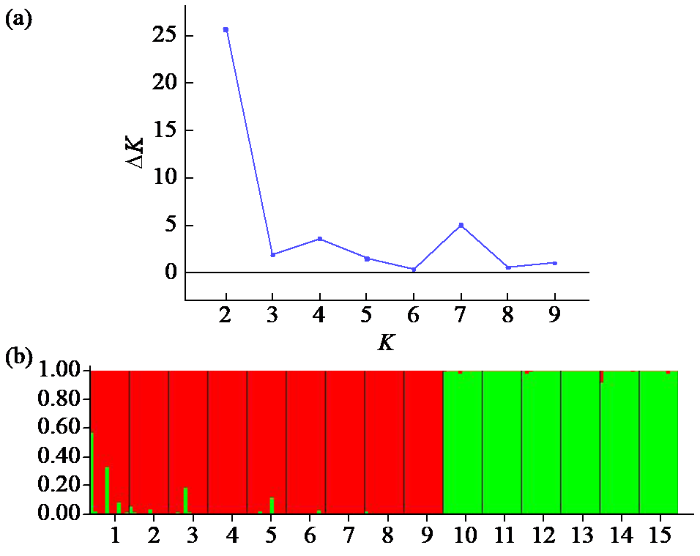
图1
15个苦参种质的遗传结构分析
(a):不同K值(2~10)对应的ΔK的关系图,(b):K=2,苦参种质资源的遗传结构
Fig.1
Genetic structure analysis of 15 S.flavescens germplasms
(a): Estimation number of populations for K ranging (2-10) by ΔK values, (b): K=2, genetic structure of S.flavescens germplasms
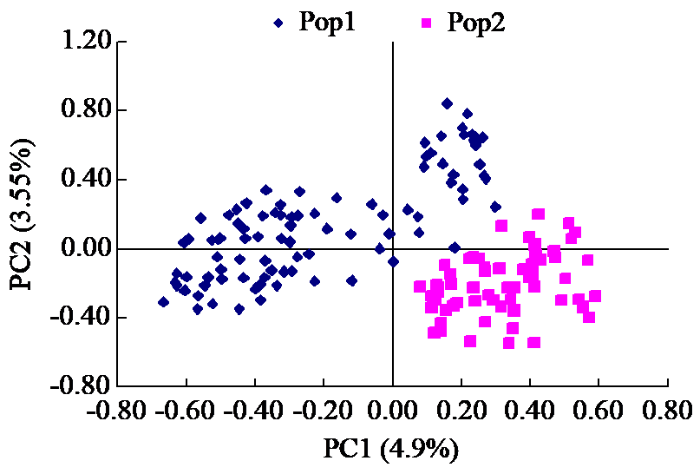
2.6 不同种质苦参PCoA分析
为进一步研究苦参15个种质间的遗传相似性及差异性,并将其结果进行可视化,利用GenAlEx 6.503软件依据苦参种质的Nei's遗传距离进行PCoA分析。结果显示,变异率贡献最高的3个特征值分别占总变异率的4.90%、3.55%和3.11%。根据分析结果绘制二维坐标图,从图2可知,150份苦参材料被划分为2个区域,表明150份苦参材料被分为2大类群,这与STRUCTURE软件的群体预测结果一致。
图2
2.7 基于Nei's遗传距离对不同苦参种质的聚类分析
如图3所示,15个种质的苦参被聚为2大类,其中来自江苏沭阳(SY)、河南焦作(HNJZ)、山东平邑(PY)、山东临沂(LY)、辽宁锦州(LNJZ)和安徽亳州(BZ)的6个种质被聚为一类,剩余9个种质被聚为另一类。UPGMA聚类结果与STRUCTURE软件预测群体结构和PCoA的结果一致。
图3
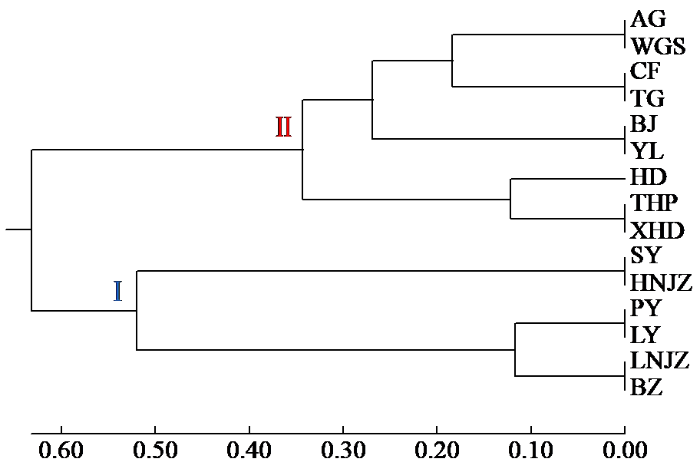
图3
基于Nei's遗传距离的15个苦参种质UPGMA的聚类结果
Fig.3
UPGMA clustering results of 15 S.flavescens germplasms based on Nei's genetic distance
3 讨论
cpSSR作为一种分子标记,既具有SSR高突变性的特点,同时具有叶绿体基因组单系遗传、几乎不发生重组的优点,随着叶绿体基因组的发展被广泛研究,目前主要应用于植物的遗传多样性、抗性新品种选育、物种进化及谱系研究等方面[33]。近年来,越来越多植物的cpSSR分子标记被开发利用。魏潇等[34]利用设计开发出的9对cpSSR引物对杏的起源和不同品种间的进化关系进行研究,发现杏在演化过程中发生了较多的适应性变异。Yan等[35]利用水松的叶绿体基因组开发出10个具有多态性和遗传多样性表征的cpSSR位点,有助于水松及其近缘物种的种群遗传和系统地理分析。李祥栋等[36]基于薏苡叶绿体基因组筛选出33对多态性cpSSR引物,对93份薏苡属资源的遗传多样性、群体结构和亲缘关系进行了研究。本试验从苦参叶绿体基因组开发的SSR位点中筛选并设计出18对cpSSR标记引物,18对引物在150份苦参材料中均可扩增出清晰明亮的条带,重复性良好,且扩增效率高。多态性信息含量是反映分子标记能力的一个重要参数,如果该标记的PIC值大于0.5,则是高度多态的,18对cpSSR的PIC值均大于0.5,证明基于苦参叶绿体基因组开发的cpSSR引物在苦参种质中具有一定的通用性,可用于后续遗传结构和多样性分析。
叶绿体SSR分子标记技术是将SSR和cpDNA优点相结合的新型技术,不仅具有重复性好、多态性高和显性遗传的特点,还由于叶绿体单亲保守遗传和较慢的进化过程更有可能检测到遗传变异。本试验基于叶绿体单倍型对18对cpSSR引物和150份苦参材料进行遗传多样性分析,结果表明,18对cpSSR引物共扩增出311个条带,平均每对引物扩增条带数为17.28。段永红等[37]基于苦参的EST序列开发出的18对EST-SSR共扩增出77个条带,平均每对引物可扩增出4.3个条带,说明基于叶绿体基因组所开发出的cpSSR具有更高的多态性,且更易检测到种质资源丰富的遗传变异。对苦参种质的遗传多样性研究结果表明,15个种质的苦参均具有较高的遗传多样性,其中来自山西武乡土河坪村(THP)的种质通过多个参数综合分析表现出最高的遗传多样性,说明山西武乡土河坪(THP)的苦参种质具有丰富的遗传变异,适应环境变化的能力强于其他种质,具有较高的进化潜力,后续可将该种质作为优良种质进行进一步研究。
群体遗传结构与整个群体的起源进化、自然分布及物种的生活特性等有很大关系,其在一定程度上可反映物种的遗传分化。通过STRUCTURE软件对苦参群体结构预测以及基于Nei's遗传距离的UPGMA聚类分析和PCoA等结果表明,15个苦参种质可分为2大类群,第1群体主要为山西、陕西、河北和内蒙古的种质,第2群体主要包括山东、安徽、河南、江苏和辽宁等地的种质,表明苦参栽培种质与其地理来源分布具有一定的相关性,表现出南北差异性。但是第2群体中还包括了辽宁产地,这可能是由于实验室所收集的部分种质材料具有一定的市场流通性,种质经过市场交易等行为后流通到另一地区。不同种质苦参AMOVA分析结果表明,15个苦参种质的遗传变异主要发生在种质群体内,所收集的苦参材料均为栽培种质,在当地栽培时间较长,培育代数较多,基因只是在当地的种质间发生交换,各地区之间的遗传交流较少,导致种质内部发生较多的基因交流及变异,这可能是种质内遗传变异大于种质间的原因。刘亚令等[38]基于SSR分子标记对黄芪的遗传结构进行分析,得出遗传变异主要发生在种质内(83%)的结论。程丽莉[39]等利用cpSSR对板栗及其近缘种和野生种进行群体遗传变异种间及种内的AMOVA分析表明,33%的遗传变异来源于种间,67%来源于种内,种内变异大于种间。这与本试验的研究结果一致。
4 结论
通过苦参叶绿体基因组筛选并开发了苦参cpSSR分子标记,18对cpSSR标记引物均表现出良好的特异性、重复性和多态性。基于叶绿体单倍型对18对cpSSR引物进行遗传多样性分析,均表现出较高的遗传多样性,可广泛应用于苦参种质资源研究中。对150份苦参材料进行遗传多样性分析,结果表明,15个种质均表现出较高的遗传多样性,其中山西武乡土河坪(THP)的种质遗传多样性最为丰富,后续可用于苦参温度胁迫响应研究。苦参种质的遗传变异主要发生在种质内。遗传结构分析表明,15个苦参种质可分为2个类群,分类结果具有一定的地域来源相关性。本研究的各类分析结果对苦参资源利用和种质创新具有重要的指导意义。
参考文献
Development of genic SSR marker resources from RNA-seq data in Camellia japonica and their application in the genus Camellia
DOI:10.1038/s41598-021-89350-w URL [本文引用: 1]
Development and use of molecular markers:past and present
DOI:10.3109/07388551.2014.959891
PMID:25430893
[本文引用: 1]

Molecular markers, due to their stability, cost-effectiveness and ease of use provide an immensely popular tool for a variety of applications including genome mapping, gene tagging, genetic diversity diversity, phylogenetic analysis and forensic investigations. In the last three decades, a number of molecular marker techniques have been developed and exploited worldwide in different systems. However, only a handful of these techniques, namely RFLPs, RAPDs, AFLPs, ISSRs, SSRs and SNPs have received global acceptance. A recent revolution in DNA sequencing techniques has taken the discovery and application of molecular markers to high-throughput and ultrahigh-throughput levels. Although, the choice of marker will obviously depend on the targeted use, microsatellites, SNPs and genotyping by sequencing (GBS) largely fulfill most of the user requirements. Further, modern transcriptomic and functional markers will lead the ventures onto high-density genetic map construction, identification of QTLs, breeding and conservation strategies in times to come in combination with other high throughput techniques. This review presents an overview of different marker technologies and their variants with a comparative account of their characteristic features and applications.
What can we do with 1000 plastid genomes?
DOI:10.1111/tpj.13491
PMID:28112435
[本文引用: 1]
The plastid genome of plants is the smallest and most gene-rich of the three genomes in each cell and the one generally present in the highest copy number. As a result, obtaining plastid DNA sequence is a particularly cost-effective way of discovering genetic information about a plant. Until recently, the sequence information gathered in this way was generally limited to small portions of the genome amplified by polymerase chain reaction, but recent advances in sequencing technology have stimulated a substantial rate of increase in the sequencing of complete plastid genomes. Within the last year, the number of complete plastid genomes accessible in public sequence repositories has exceeded 1000. This sudden flood of data raises numerous challenges in data analysis and interpretation, but also offers the keys to potential insights across large swathes of plant biology. We examine what has been learnt so far, what more could be learnt if we look at the data in the right way, and what we might gain from the tens of thousands more genome sequences that will surely arrive in the next few years. The most exciting new discoveries are likely to be made at the interdisciplinary interfaces between molecular biology and ecology.© 2017 The Authors The Plant Journal © 2017 John Wiley & Sons Ltd.
Molecular structure and phylogenetic analyses of complete chloroplast genomes of two aristolochia medicinal species
DOI:10.3390/ijms18091839 URL [本文引用: 1]
Comparative chloroplast genomes of eleven Schima (Theaceae) species:insights into DNA barcoding and phylogeny
DOI:10.1371/journal.pone.0178026 URL [本文引用: 1]
Comparative analysis of six Lagerstroemia complete chloroplast genomes
The complete chloroplast genome of Catha edulis:a comparative analysis of genome features with related species
DOI:10.3390/ijms19020525 URL [本文引用: 1]
Molecular linkage mapping and marker-trait associations with NIRPT,a downy mildew resistance gene in Nicotiana langsdorffii
Genetic structure of coast redwood (Sequoia sempervirens [D. Don] Endl.) populations in and outside of the natural distribution range based on nuclear and chloroplast microsatellite markers
DOI:10.1371/journal.pone.0243556 URL [本文引用: 1]
Comparative genomics of 11 complete chloroplast genomes of Senecioneae (Asteraceae) species:DNA barcodes and phylogenetics
DOI:10.1186/s40529-019-0265-y URL [本文引用: 1]
Plastome evolution in the Caesalpinia group (Leguminosae) and its application in phylogenomics and populations genetics
DOI:10.1007/s00425-021-03655-8
PMID:34236509
[本文引用: 1]
The chloroplast genomes of Caesalpinia group species are structurally conserved, but sequence level variation is useful for both phylogenomic and population genetic analyses. Variation in chloroplast genomes (plastomes) has been an important source of information in plant biology. The Caesalpinia group has been used as a model in studies correlating ecological and genomic variables, yet its intergeneric and infrageneric relationships are not fully solved, despite densely sampled phylogenies including nuclear and plastid loci by Sanger sequencing. Here, we present the de novo assembly and characterization of plastomes from 13 species from the Caesalpinia group belonging to eight genera. A comparative analysis was carried out with 13 other plastomes previously available, totalizing 26 plastomes and representing 15 of the 26 known Caesalpinia group genera. All plastomes showed a conserved quadripartite structure and gene repertoire, except for the loss of four ndh genes in Erythrostemon gilliesii. Thirty polymorphic regions were identified for inter- or intrageneric analyses. The 26 aligned plastomes were used for phylogenetic reconstruction, revealing a well-resolved topology, and dividing the Caesalpinia group into two fully supported clades. Sixteen microsatellite (cpSSR) loci were selected from Cenostigma microphyllum for primer development and at least two were cross-amplified in different Leguminosae subfamilies by in vitro or in silico approaches. Four loci were used to assess the genetic diversity of C. microphyllum in the Brazilian Caatinga. Our results demonstrate the structural conservation of plastomes in the Caesalpinia group, offering insights into its systematics and evolution, and provides new genomic tools for future phylogenetic, population genetics, and phylogeographic studies.
Optimization of DNA extraction from seeds and fresh leaf tissues of wild marigold (Tagetes minuta) for polymerase chain reaction analysis
DOI:10.4238/vol9-1gmr747
PMID:20309824
[本文引用: 1]
Tagetes, a genus of flowering marigolds in the family Asteraceae (Compositeae), is reported to be a medicinal plant with hypotensive, spasmolytic, anti-inflammatory, antimicrobial, and antifungal properties. Tagetes minuta characteristically contains high concentrations of essential oils, flavonoids, polyphenols, and polysaccharides that interfere with DNA, causing erroneous or no PCR products. We tested and modified various standard protocols in an effort to isolate high-quality DNA from different plant tissues of T. minuta. We used sun-dried, shade-dried and fresh-leaf tissues, as well as seeds for DNA analysis. The DNA obtained from seeds and fresh-leaf tissues with a modified cetyltrimethylammonium bromide buffer protocol was of good quality, with no colored pigments and contaminants. We were able to obtain good quality DNA from fresh leaf tissues without using liquid nitrogen. A relatively large amount of DNA was also extracted from the sun- and shade-dried tissues, but its quality was not as good as that from seeds. The DNA extracted from seeds and fresh leaves was successfully amplified by PCR using arbitrary RAPD primers. The same protocol will probably be useful for extracting high-molecular weight DNA from other plant materials containing large amounts of secondary metabolites and essential oils.
MISA-web:a web server for microsatellite prediction
DOI:10.1093/bioinformatics/btx198 URL [本文引用: 1]
GenAlEx 6.5:genetic analysis in Excel. Population genetic software for teaching and research-an update
GenAlEx: Genetic Analysis in Excel is a cross-platform package for population genetic analyses that runs within Microsoft Excel. GenAlEx offers analysis of diploid codominant, haploid and binary genetic loci and DNA sequences. Both frequency-based (F-statistics, heterozygosity, HWE, population assignment, relatedness) and distance-based (AMOVA, PCoA, Mantel tests, multivariate spatial autocorrelation) analyses are provided. New features include calculation of new estimators of population structure: G'(ST), G''(ST), Jost's D(est) and F'(ST) through AMOVA, Shannon Information analysis, linkage disequilibrium analysis for biallelic data and novel heterogeneity tests for spatial autocorrelation analysis. Export to more than 30 other data formats is provided. Teaching tutorials and expanded step-by-step output options are included. The comprehensive guide has been fully revised.GenAlEx is written in VBA and provided as a Microsoft Excel Add-in (compatible with Excel 2003, 2007, 2010 on PC; Excel 2004, 2011 on Macintosh). GenAlEx, and supporting documentation and tutorials are freely available at: http://biology.anu.edu.au/GenAlEx.rod.peakall@anu.edu.au.
Power Marker:an integrated analysis environment for genetic marker analysis
DOI:10.1093/bioinformatics/bti282 URL [本文引用: 1]
MEGA X:molecular evolutionary genetics analysis across computing platforms
DOI:10.1093/molbev/msy096 URL [本文引用: 1]
The neighbor-joining method:a new method for reconstructing phylogenetic trees
DOI:10.1093/oxfordjournals.molbev.a040454
PMID:3447015
[本文引用: 1]
A new method called the neighbor-joining method is proposed for reconstructing phylogenetic trees from evolutionary distance data. The principle of this method is to find pairs of operational taxonomic units (OTUs [= neighbors]) that minimize the total branch length at each stage of clustering of OTUs starting with a starlike tree. The branch lengths as well as the topology of a parsimonious tree can quickly be obtained by using this method. Using computer simulation, we studied the efficiency of this method in obtaining the correct unrooted tree in comparison with that of five other tree-making methods: the unweighted pair group method of analysis, Farris's method, Sattath and Tversky's method, Li's method, and Tateno et al.'s modified Farris method. The new, neighbor-joining method and Sattath and Tversky's method are shown to be generally better than the other methods.
Detexting the number of clusters of individuals using the software STRUCTURE:a simulation study
DOI:10.1111/j.1365-294X.2005.02553.x
PMID:15969739
[本文引用: 1]
The identification of genetically homogeneous groups of individuals is a long standing issue in population genetics. A recent Bayesian algorithm implemented in the software STRUCTURE allows the identification of such groups. However, the ability of this algorithm to detect the true number of clusters (K) in a sample of individuals when patterns of dispersal among populations are not homogeneous has not been tested. The goal of this study is to carry out such tests, using various dispersal scenarios from data generated with an individual-based model. We found that in most cases the estimated 'log probability of data' does not provide a correct estimation of the number of clusters, K. However, using an ad hoc statistic DeltaK based on the rate of change in the log probability of data between successive K values, we found that STRUCTURE accurately detects the uppermost hierarchical level of structure for the scenarios we tested. As might be expected, the results are sensitive to the type of genetic marker used (AFLP vs. microsatellite), the number of loci scored, the number of populations sampled, and the number of individuals typed in each sample.
STRUCTURE HARVESTER:a website and program for visualizing STRUCTURE output and implementing the Evanno method
DOI:10.1007/s12686-011-9548-7 URL [本文引用: 1]
Development of chloroplast microsatellite markers for Glyptostrobus pensilis (Cupressaceae)
基于SSR分子标记的药用黄芪遗传多样性与遗传结构分析
DOI:10.11733/j.issn.1007-0435.2019.05.006
[本文引用: 1]
为了能更好的了解药用黄芪(Astragali Radix)遗传多样性及遗传结构,本试验利用10对SSR引物对来自17个产地共380个样本的蒙古黄芪、膜荚黄芪进行遗传多样性及结构分析,结果显示药用黄芪具有较高程度的遗传多样性水平(I=2.112,H=0.781),其中蒙古黄芪遗传多样性水平(I=2.241,H=0.804)要高于膜荚黄芪(I=1.982,H=0.757),且两种黄芪的遗传变异主要发生在居群内;UPGMA聚类分析及STRUCTURE居群遗传结构分析可将其分为3组,即膜荚黄芪为单独一组,蒙古黄芪分为两组,其中来自山西产区的大部分居群分为一组,来自内蒙产区及部分山西产区的居群分为另一组。本研究结果对药用黄芪种质资源的有效利用、遗传多样性的保护、育种及开发优质黄芪种质资源提供一定的理论基础。
板栗及其近缘种叶绿体SSR遗传多样性分析
DOI:10.7668/hbnxb.2015.02.026
[本文引用: 1]
为了探明板栗及其近缘种的亲缘关系并分析栗属的遗传多样性,基于叶绿体微卫星标记技术,选用4对呈现多态性的cpSSR引物,对板栗及其近缘种、野生种共6个种,56份材料进行遗传结构、遗传关系等分析。4个位点扩增等位基因数(Na)平均为3.25,有效等位基因数(Ne)平均为2.554,期望杂合度(He)平均为0.606,群体Nei's遗传多样性(Hs)为0.320,各遗传参数值均低于核基因组对群体研究的相应值。另外,各种之间有丰富的cpSSR多样性,尤以野生板栗多样性指数最高。结果表明,我国天然野生板栗群体内蕴含更丰富的遗传变异,为我国板栗野生种质保育及可持续开发利用提供了基础数据和科学依据。
