


普通豇豆(Vigna unguiculata)为一年生草本植物,栽培历史悠久,早在2000~3000年前,亚欧非大陆的多个古老文明区域便已存在食用、运输和储藏普通豇豆的相关记录,目前该作物广泛分布于全球热带、亚热带及部分温带干旱区域[1]。普通豇豆具有良好的耐旱、耐贫瘠特性及强环境适应能力,其根系固氮能力强,能有效控制种植区域的杂草和水土流失,常用于禾本科作物的轮作或间作套种等[2]。在我国,普通豇豆主要种植在南方各省及西北、东北干旱、半干旱区及生态条件较差的丘陵山区[3-4]。普通豇豆富含蛋白质(25%~32%)、碳水化合物(50%~65%)、维生素和矿物质,且脂肪含量低(1%),是发展中国家摄入植物性蛋白和膳食纤维的主要来源之一,茎秆、叶片等地上部分还可作为牲畜饲料[5]。除营养价值外,普通豇豆还用于预防或治疗多种疾病,如控制血糖[6]、维持血液中的低密度脂蛋白胆固醇水平[7]及阻止癌细胞的生长[8]。
在国家现代农业产业技术体系的资助下,我国豇豆遗传育种取得了长足进展,先后完成两轮全国性新品种联合鉴定,并分别筛选出适合不同生态区种植的新品种[9]。这些新品种的推广利用一定程度上提升了我国普通豇豆的生产水平。随着育种工作的推进,近年来成功选育了一批高产优质的新品种。由于普通豇豆光温敏感,南方品种引种到北方种植有风险,因此,为了进一步评估新品种的生态适应性和产量潜力,国家食用豆产业技术体系于2022-2024年对14个普通豇豆新品种(系)开展了新一轮的联合鉴定。本文分析了14个普通豇豆新品种(系)在全国14个试验点的表型变异及产量表现,并解析出不同品种(系)的高产、稳产及环境适应能力,为新品种(系)鉴定及推广应用提供科学依据。
1 材料与方法
1.1 试验材料
14 个普通豇豆品种(系)来自5家育种单位(表1),中豇1号为对照品种(CK)。
表1 14个普通豇豆新品种(系)信息
Table 1
| 编号Number | 品种(系)Variety (line) | 籽粒颜色Seed color | 籽粒形状Seed shape | 供种单位Seed supply unit |
|---|---|---|---|---|
| 1 | 辽豇豆3号* | 深红色 | 肾形 | 辽宁省农业科学院 |
| 2 | JD16-1-1-1-6-4-4 | 白色黑脐 | 圆形 | 青岛市农业科学院 |
| 3 | 桂豇豆1805 | 白色深红脐 | 长肾形 | 广西壮族自治区农业科学院 |
| 4 | 桂豇21-2* | 黑色 | 椭圆形 | 广西壮族自治区农业科学院 |
| 5 | 冀豇1302-2 | 白色黑脐 | 肾形 | 河北省农林科学院 |
| 6 | 冀豇1101-64-1-2 | 黑白双色 | 短肾形 | 河北省农林科学院 |
| 7 | 冀豇1303-3-1-1 | 黑白双色 | 短肾形 | 河北省农林科学院 |
| 8 | 冀豇1315-6-2-2* | 灰黄色 | 宽肾形 | 河北省农林科学院 |
| 9 | 品豇12 | 紫红白双色 | 长肾形 | 中国农业科学院作物科学研究所 |
| 10 | 品豇13 | 黑色 | 圆形 | 中国农业科学院作物科学研究所 |
| 11 | 品豇14* | 红黄色 | 宽肾形 | 中国农业科学院作物科学研究所 |
| 12 | 品豇16 | 黑白双色 | 圆形 | 中国农业科学院作物科学研究所 |
| 13 | 品豇18 | 白色黑脐 | 圆形 | 中国农业科学院作物科学研究所 |
| 14 | 中豇1号(CK)* | 暗红色 | 肾形 | 中国农业科学院作物科学研究所 |
“*”表示参加生产试验。
“*”indicates participation in production trial.
1.2 试验设计
联合鉴定试验于2022-2024年开展,为期3年。其中,2022-2023年为新品种联合鉴定试验,2024年为生产试验。试验期间,选择地势平坦、茬口一致、地力均匀、肥力中上等、有灌溉条件的田块作为试验地。一般春播区在5月中旬,夏播区在6月中下旬(表2)。
表2 14个试验点普通豇豆的播种期
Table 2
| 生态区 Ecological region | 试验点 Test site | 播种期Sowing date | ||
|---|---|---|---|---|
| 2022 | 2023 | 2024 | ||
| 北方春播区 Northern Spring Sowing Area | 吉林省长春市(E1) | 05-28 | 05-22 | 05-16 |
| 河北省保定市(E2) | 06-24 | 06-02 | 06-21 | |
| 内蒙古自治区赤峰市(E3) | 05-25 | 05-26 | 05-10 | |
| 黑龙江省齐齐哈尔市(E4) | 05-18 | 05-16 | 05-20 | |
| 辽宁省沈阳市(E5) | 06-12 | 06-06 | 06-05 | |
| 内蒙古自治区呼和浩特市(E6) | - | 05-15 | 05-19 | |
| 山西省太原市(E7) | - | 06-02 | 05-29 | |
| 北方夏播区 Northern Summer Sowing Area | 河北省唐山市(E8) | 06-23 | 06-22 | 06-19 |
| 陕西省榆林市(E9) | 05-16 | 05-17 | 05-08 | |
| 河北省石家庄市(E10) | 06-29 | 06-25 | 06-27 | |
| 北京市(E11) | 06-18 | 06-17 | 06-17 | |
| 南方区South Region | 江苏省南京市(E12) | 06-22 | 07-25 | 06-24 |
| 广西壮族自治区南宁市(E13) | 07-08 | 07-29 | 07-30 | |
| 河南省南阳市(E14) | 06-12 | 06-24 | 06-16 | |
2022-2023年,采用随机区组排列,每个品种4行区,行长5 m,小区面积10 m2,3次重复。株距12~15 cm,行距40~50 cm,播深3~4 cm。留苗密度12万~15万株/hm2。播深3~4 cm,播种要深浅一致、均匀。2024年生产试验以中豇1号为CK,试验不设重复,每个品种(系)种植面积200~350 m2,留苗密度12万~15万株/hm2,田间管理等同于大田水平。生育期间,参考《豇豆种质资源描述规范和数据标准》[10]调查株高、生育期、主茎分枝数、单株荚数、百粒重、单荚粒数和荚长7个性状。产量按单个小区实收面积折算为公顷产量计算。品种效应=品种产量-所有参试品种的平均产量。
1.3 数据处理
采用DPS 9.0和Microsoft Excel进行数据处理及分析。采用SPSS 27软件进行单因素方差分析(ANOVA)。
2 结果与分析
2.1 不同试验点间普通豇豆新品种(系)的农艺性状变异分析
14个品种(系)在所有试验点连续2年均能正常成熟收获,以下各主要农艺性状数据均为2年试验均值,且试验点间各品种(系)性状变异明显。对不同试验点主要农艺性状的比较(表3)发现,参试品种(系)主茎分枝数平均值为1.2(黑龙江省齐齐哈尔市)~19.6(陕西省榆林市),内蒙古自治区赤峰市的荚长最长(21.6 cm),辽宁省沈阳市的荚长最短(13.8 cm)。14个试验点的株高变化较明显,株高范围在36.5(河南省南阳市)~89.9 cm(北京市)。单株荚数以江苏省南京市最大(30.1),河北省保定市最小(10.5)。单荚粒数在各试点间差异显著,其中内蒙古自治区赤峰市最大(16.4),吉林省长春市最小(9.1)。百粒重的变幅为8.8(吉林省长春市)~17.8 g(江苏省南京市)。生育期变幅为55(广西壮族自治区南宁市)~105 d(黑龙江省齐齐哈尔市),不同生态区的生育期表现差异明显。
表3 2个年度14个试点参试品种(系)主要农艺性状
Table 3
| 生态区 Ecological region | 试验点 Test site | 数值 Value | 主茎分枝数 Number of main stem branches | 株高 Plant height (cm) | 单株荚数 Number of pods per plant | 百粒重 100-seed weight (g) | 单荚粒数 Number of seeds per pod | 荚长 Pod length (cm) | 生育期 Growth period (d) |
|---|---|---|---|---|---|---|---|---|---|
| 北方春播区 Northern Spring Sowing Area | E1 | 最大值 | 4.7 | 99.4 | 25.7 | 13.4 | 12.3 | 19.3 | 81 |
| 最小值 | 1.2 | 24.1 | 6.1 | 20.6 | 15.3 | 11.7 | 71 | ||
| 平均值 | 2.7 | 56.4 | 14.4 | 8.8 | 9.1 | 15.6 | 77 | ||
| E2 | 最大值 | 5.5 | 52.8 | 12.7 | 18.5 | 16.2 | 20.5 | 75 | |
| 最小值 | 3.3 | 62.5 | 6.7 | 8.2 | 6.9 | 10.2 | 67 | ||
| 平均值 | 4.3 | 44.5 | 10.5 | 12.6 | 10.5 | 15.6 | 71 | ||
| E3 | 最大值 | 6.2 | 152.6 | 47.0 | 21.6 | 25.4 | 35.2 | 110 | |
| 最小值 | 1.1 | 30.7 | 12.0 | 10.5 | 8.8 | 12.4 | 95 | ||
| 平均值 | 3.3 | 78.7 | 23.0 | 15.1 | 16.4 | 21.6 | 102 | ||
| E4 | 最大值 | 2.9 | 91.6 | 18.9 | 22.1 | 13.7 | 21.4 | 118 | |
| 最小值 | 0.3 | 40.0 | 6.5 | 10.0 | 8.1 | 11.9 | 99 | ||
| 平均值 | 1.2 | 58.6 | 10.8 | 14.6 | 10.4 | 15.8 | 105 | ||
| E5 | 最大值 | 5.4 | 102.5 | 33.1 | 21.1 | 16.5 | 18.7 | 74 | |
| 最小值 | 2.2 | 43.1 | 12.7 | 10.9 | 5.5 | 9.0 | 86 | ||
| 平均值 | 3.7 | 66.3 | 20.3 | 14.6 | 11.4 | 13.8 | 67 | ||
| E6 | 最大值 | 6.4 | 83.2 | 24.4 | 21.8 | 12.8 | 17.2 | 99 | |
| 最小值 | 3.4 | 52.7 | 8.3 | 10.4 | 7.8 | 10.6 | 87 | ||
| 平均值 | 4.9 | 62.8 | 15.2 | 15.2 | 10.1 | 13.9 | 92 | ||
| E7 | 最大值 | 5.2 | 52.7 | 19.7 | 19.0 | 11.7 | 18.5 | 93 | |
| 最小值 | 1.6 | 25.7 | 4.1 | 11.6 | 6.5 | 11.6 | 77 | ||
| 平均值 | 3.7 | 37.2 | 12.5 | 14.7 | 9.7 | 14.4 | 81 | ||
| 北方夏播区 Northern Summer Sowing Area | E8 | 最大值 | 5.1 | 83.0 | 25.1 | 18.7 | 13.8 | 20.0 | 88 |
| 最小值 | 2.1 | 50.5 | 8.4 | 9.6 | 8.3 | 11.1 | 60 | ||
| 平均值 | 3.6 | 63.4 | 16.8 | 13.6 | 11.3 | 14.6 | 65 | ||
| E9 | 最大值 | 31.0 | 81.0 | 16.5 | 21.4 | 28.8 | 19.1 | 106 | |
| 最小值 | 11.7 | 26.2 | 7.6 | 13.6 | 13.3 | 12.0 | 70 | ||
| 平均值 | 19.6 | 51.4 | 12.5 | 16.3 | 22.2 | 14.6 | 91 | ||
| E10 | 最大值 | 3.6 | 64.7 | 17.4 | 21.6 | 12.1 | 18.7 | 80 | |
| 最小值 | 1.9 | 44.3 | 6.9 | 11.7 | 8.5 | 12.3 | 69 | ||
| 平均值 | 2.8 | 53.8 | 12.1 | 15.5 | 10.6 | 14.9 | 74 | ||
| E11 | 最大值 | 25.3 | 164.6 | 19.7 | 22.1 | 14.9 | 21.4 | 96 | |
| 最小值 | 10.3 | 66.9 | 9.5 | 10.4 | 7.7 | 12.6 | 62 | ||
| 平均值 | 15.4 | 89.9 | 15.1 | 14.7 | 11.5 | 16.4 | 77 | ||
| 南方区 South Region | E12 | 最大值 | 6.3 | 72.3 | 45.3 | 25.6 | 17.5 | 21.6 | 107 |
| 最小值 | 3.6 | 39.5 | 24.3 | 12.4 | 10.5 | 9.6 | 69 | ||
| 平均值 | 5.2 | 53.3 | 30.1 | 17.8 | 13.4 | 14.4 | 85 | ||
| E13 | 最大值 | 3.5 | 57.8 | 20.8 | 18.2 | 15.9 | 19.8 | 66 | |
| 最小值 | 0.7 | 24.3 | 10.2 | 9.2 | 9.0 | 12.2 | 48 | ||
| 平均值 | 2.2 | 43.5 | 14.7 | 13.2 | 12.6 | 16.1 | 55 | ||
| E14 | 最大值 | 8.9 | 58.5 | 19.2 | 19.8 | 11.9 | 19.0 | 66 | |
| 最小值 | 1.6 | 16.2 | 7.2 | 11.2 | 6.9 | 11.4 | 48 | ||
| 平均值 | 4.3 | 36.5 | 12.8 | 15.1 | 9.7 | 15.1 | 58 |
此外,单株荚数和单荚粒数在各试验点变化明显,变化趋势在试点间基本一致(图1)。其中单株荚数以南京最高(30.1),保定最低(10.5);其变异系数除了在北京、南京和南宁小于20%外,在其他试验点介于23.35%~42.88%。
图1
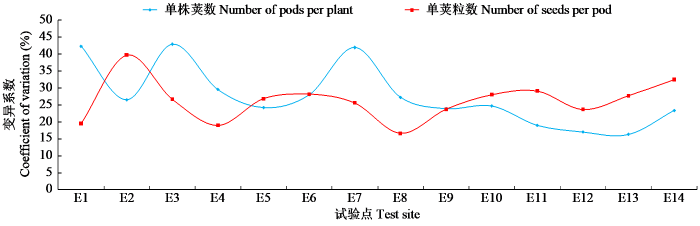
图1
单株荚数与单荚粒数变异系数比较
Fig.1
Comparison of coefficient variation of between number of pods per plant and number of seeds per pod
2.2 不同生态区间普通豇豆新品种(系)的性状变异分析
综合普通豇豆品种(系)主要农艺性状在各生态区及试点间的表现,各性状变异系数差异明显,反映出不同性状受环境影响差异明显(表4)。14个试验点的7个主要农艺性状变异系数平均值排序为主茎分枝数>单株荚数>株高>百粒重>单荚粒数>荚长>生育期,其中主茎分枝数、单株荚数和株高的变异系数整体偏高,受环境影响较大;生育期的变异系数最低,是最稳定的性状。
表4 2个年度14个试验点参试品种(系)主要农艺性状变异系数
Table 4
| 生态区 Ecological region | 试验点 Test site | 主茎分枝数 Number of main stem branches | 株高 Plant height | 单株荚数 Number of pods per plant | 百粒重 100-seed weight | 单荚粒数 Number of seeds per pod | 荚长 Pod length | 生育期 Growth period |
|---|---|---|---|---|---|---|---|---|
| 北方春播区 Northern Spring Sowing Area | E1 | 61 | 63 | 64 | 42 | 25 | 24 | 7 |
| E2 | 25 | 17 | 31 | 39 | 42 | 33 | 6 | |
| E3 | 72 | 70 | 66 | 35 | 49 | 50 | 7 | |
| E4 | 90 | 41 | 52 | 39 | 26 | 29 | 9 | |
| E5 | 43 | 42 | 47 | 33 | 49 | 35 | 13 | |
| E6 | 31 | 23 | 51 | 36 | 24 | 24 | 69 | |
| E7 | 52 | 35 | 65 | 25 | 28 | 23 | 10 | |
| 北方夏播区 Northern Summer Sowing Area | E8 | 42 | 25 | 50 | 33 | 25 | 29 | 21 |
| E9 | 47 | 52 | 37 | 23 | 36 | 24 | 20 | |
| E10 | 31 | 19 | 43 | 31 | 17 | 21 | 7 | |
| E11 | 45 | 48 | 35 | 38 | 32 | 26 | 22 | |
| 南方区South Region | E12 | 27 | 30 | 33 | 36 | 25 | 40 | 22 |
| E13 | 66 | 40 | 35 | 33 | 28 | 24 | 16 | |
| E14 | 75 | 57 | 46 | 28 | 26 | 25 | 16 | |
| 均值Mean | 51 | 40 | 47 | 34 | 31 | 29 | 18 | |
主茎分枝数受环境影响最大,变异系数范围为25%~90%,其中齐齐哈尔最高,保定最低,多数试点的变异系数超过40%。株高的变异系数范围为17%~70%,其中赤峰最高,保定最低,不同生态区的株高表现差异明显。单株荚数变异系数分布在31%~66%,同样以赤峰最高,保定最低,此外,多数试点变异系数超过40%,说明该性状对环境条件变化具备较高敏感性。百粒重变异系数范围处于23%~42%,长春变异程度最大,榆林最小,整体属于中等变异水平,且大部分试点变异系数集中在30%~40%。单荚粒数变异幅度为17%~49%,赤峰与沈阳变异系数并列最高,石家庄最低,各试验点数值多集中于20%~40%,整体变异程度居中。荚长变异系数范围为21%~50%,赤峰试验点变异最高,石家庄试点变异最低,综合整体表现为中等偏上的变异特征。生育期在各试验点间变异系数波动为6%~69%,呼和浩特变异幅度远高于其他试验点位,保定变异程度最低;除呼和浩特外,其余多数试验点变异系数均低于25%,性状整体表现相对稳定。
结合生态区划分来看,不同区域的性状变异特征存在明显差异。北方春播区中,株高的变异系数保定最低(17%),赤峰最高(70%);主茎分枝数变异系数普遍偏高,齐齐哈尔和赤峰均超过70%;生育期变异系数普遍低于15%,表现稳定。北方夏播区的株高变异系数低于北方春播区;单株荚数变异系数多在35%~50%,变异程度较高;生育期变异系数在7%~22%,整体稳定性较好。南方夏播区的株高变异系数南京、南宁和南阳试验点均超过30%;单株荚数变异系数在33%~46%,整体变异程度中等。
2.3 不同普通豇豆新品种(系)产量分析
参试品种(系)在14个试验点的产量和差异分析如表5所示。在北方春播区,随着各试验点纬度的增加,产量的变化基本一致。产量排名前3位的品种分别是冀豇1315-6-2-2>辽豇豆3号>JD16-1-1-1-6-4-4。其中冀豇1315-6-2-2较CK增产16.94%,辽豇豆3号和JD16-1-1-1-6-4-4分别增产10.64%和0.48%。在北方夏播区,随着试验点纬度的增加,产量均呈先增后减的趋势。产量排名前3位的品种分别是冀豇1315-6-2-2>品豇14>品豇16。冀豇1315-6-2-2、品豇14和品豇16较CK分别增产40.73%、31.09%和21.25%。在南方区,产量随试验点纬度的增加呈现递减趋势,并在南京有小幅度的增加。产量排名前3位的品种分别是冀豇1315-6-2-2>品豇14>冀豇1101- 64-1-2。冀豇1315-6-2-2、品豇14和1101-64-1-2较CK增产幅度相差不大,平均增幅为14.67%。
表5 豇豆品种(系)在不同生态区的产量表现
Table 5
| 编号 Number | 品种(系) Variety (line) | 北方春播区 Northern Spring Sowing Area | 北方夏播区 Northern Summer Sowing Area | 南方区 South Region | |||||
|---|---|---|---|---|---|---|---|---|---|
| 产量 Yield (kg/hm2) | 增产率 Yield increase rate (%) | 产量 Yield (kg/hm2) | 增产率 Yield increase rate (%) | 产量 Yield (kg/hm2) | 增产率 Yield increase rate (%) | ||||
| 1 | 辽豇豆3号 | 1992.4 | 10.64 | 1470.3 | 7.22 | 2142.8 | 11.36 | ||
| 2 | JD16-1-1-1-6-4-4 | 1789.1 | 0.48 | 1347.8 | -1.22 | 2040.1 | 6.90 | ||
| 3 | 桂豇豆1805 | 1781.6 | 0.06 | 1195.2 | -14.14 | 2028.9 | 6.39 | ||
| 4 | 桂豇21-2 | 1753.9 | -1.52 | 1585.7 | 13.97 | 2032.5 | 6.55 | ||
| 5 | 冀豇1302-2 | 1612.4 | -10.43 | 1308.3 | -4.27 | 2077.3 | 8.57 | ||
| 6 | 冀豇1101-64-1-2 | 1478.6 | -20.42 | 1504.5 | 9.33 | 2157.6 | 11.97 | ||
| 7 | 冀豇1303-3-1-1 | 1456.9 | -22.21 | 1353.6 | -0.78 | 1950.3 | 2.61 | ||
| 8 | 冀豇1315-6-2-2 | 2143.7 | 16.94 | 2301.7 | 40.73 | 2305.3 | 17.61 | ||
| 9 | 品豇12 | 1644.7 | -8.26 | 1333.3 | -2.32 | 2034.2 | 6.63 | ||
| 10 | 品豇13 | 1619.3 | -9.95 | 1320.2 | -3.33 | 1096.2 | -73.26 | ||
| 11 | 品豇14 | 1648.2 | -8.03 | 1979.6 | 31.09 | 2219.3 | 14.42 | ||
| 12 | 品豇16 | 1639.7 | -8.59 | 1732.3 | 21.25 | 2093.1 | 9.26 | ||
| 13 | 品豇18 | 1613.4 | -10.36 | 1579.6 | 13.64 | 1987.6 | 4.44 | ||
| 14 | 中豇1号(CK) | 1780.5 | 0.00 | 1364.2 | 0.00 | 1899.3 | 0.00 | ||
表6 品种(系)丰产性及其稳定性分析
Table 6
| 序号 Number | 品种 Variety (line) | 丰产性参数High yield parameter | 稳定性参数Stability parameter | 适应地区 Adaptation region | ||||
|---|---|---|---|---|---|---|---|---|
| 产量 Yield (kg/hm2) | 品种效应 Variety effect | 方差 Variance | 变异系数 CV (%) | 回归系数 β | ||||
| 1 | 辽豇豆3号 | 1868.50 | 121.00 | 10.95 | 18.65 | 1.03 | E1~E14 | |
| 2 | JD16-1-1-1-6-4-4 | 1725.67 | -21.84 | 4.50 | 12.40 | 0.97 | E1~E14 | |
| 3 | 桂豇豆1805 | 1668.57 | -78.94 | 14.00 | 22.56 | 1.03 | E1,E3,E4,E6,E7 | |
| 4 | 桂豇21-2 | 1790.70 | 43.20 | 9.00 | 16.78 | 0.99 | E4,E7,E11,E12 | |
| 5 | 冀豇1302-2 | 1666.00 | -81.50 | 8.95 | 14.66 | 0.96 | E1~E14 | |
| 6 | 冀豇1101-64-1-2 | 1713.57 | -33.94 | 9.45 | 19.52 | 0.98 | E1,E2,E3,E7,E8,E9,E13,E14 | |
| 7 | 冀豇1303-3-1-1 | 1586.93 | -160.57 | 13.15 | 24.76 | 0.81 | E2,E11,E12,E14 | |
| 8 | 冀豇1315-6-2-2 | 2250.23 | 502.73 | 13.40 | 16.32 | 1.20 | E1~E14 | |
| 9 | 品豇12 | 1670.73 | -76.77 | 8.65 | 18.84 | 1.05 | E5,E6,E7,E9,E11,E13 | |
| 10 | 品豇13 | 1345.23 | -402.27 | 6.90 | 17.41 | 0.88 | E1,E4,E5,E8,9,E10,E11 | |
| 11 | 品豇14 | 1949.03 | 201.53 | 12.95 | 20.52 | 0.95 | E1~E14 | |
| 12 | 品豇16 | 1821.70 | 74.20 | 8.90 | 17.46 | 0.99 | E1~E14 | |
| 13 | 品豇18 | 1726.87 | -20.64 | 6.10 | 15.28 | 1.03 | E1~E14 | |
| 14 | 中豇1号(CK) | 1681.33 | -66.17 | 11.75 | 19.56 | 1.12 | E1~E14 | |
表7 不同品种(系)产量差异分析
Table 7
| 编号 Number | 品种(系) Variety (line) | P < 0.05 | P < 0.01 | 产量 Yield (kg/hm2) | 增产率 Yield increase rate (%) |
|---|---|---|---|---|---|
| 1 | 辽豇豆3号 | d | D | 1851.75 | 13.15 |
| 2 | JD16-1-1-1-6-4-4 | e | E | 1776.30 | 11.02 |
| 3 | 桂豇豆1805 | n | N | 1521.15 | -12.71 |
| 4 | 桂豇21-2 | c | C | 1928.40 | 20.01 |
| 5 | 冀豇1302-2 | gh | GH | 1711.20 | 5.87 |
| 6 | 冀豇1101-64-1-2 | fg | FG | 1742.55 | 8.66 |
| 7 | 冀豇1303-3-1-1 | lm | LM | 1619.70 | 3.49 |
| 8 | 冀豇1315-6-2-2 | a | A | 2238.30 | 39.15 |
| 9 | 品豇12 | hil | HIL | 1683.90 | 0.72 |
| 10 | 品豇13 | kl | KL | 1638.15 | -0.37 |
| 11 | 品豇14 | b | B | 2000.85 | 27.16 |
| 12 | 品豇16 | ef | EF | 1753.05 | 10.13 |
| 13 | 品豇18 | jk | JK | 1644.60 | 2.02 |
| 14 | 中豇1号(CK) | i | I | 1667.10 | 0.00 |
2.4 生产试验分析
基于联合鉴定结果分析,综合各品种(系)的产量表现与田间生长状况,分别筛选出5个品种在全国14个试验点生产试验(表8)。最终筛选出适宜北方春播区的有辽豇豆3号(1972.42 kg/hm2)、冀豇1101-64-1-2(2219.19 kg/hm2)和桂豇21-2(1655.90 kg/hm2)。适宜北方夏播区的有冀豇1101-64-1-2(2050.86 kg/hm2)、JD16-1-1-1-6-4-4(1473.80 kg/hm2)和品豇14(1682.31 kg/hm2)。适宜南方区的有品豇14(2540.25 kg/hm2)和辽豇豆3号(2737.50 kg/hm2)。
表8 不同品种(系)生产试验产量表现
Table 8
| 编号 Number | 品种 (系) Variety (line) | 北方春播区 Northern Spring Sowing Area | 北方夏播区 Northern Summer Sowing Area | 南方区 South Region | |||||
|---|---|---|---|---|---|---|---|---|---|
| 产量 Yield (kg/hm2) | 增产率 Yield increase rate (%) | 产量 Yield (kg/hm2) | 增产率 Yield increase rate (%) | 产量 Yield (kg/hm2) | 增产率 Yield increase rate (%) | ||||
| 1 | 辽豇豆3号 | 1972.42 | 39.21 | - | - | 2737.50 | 46.63 | ||
| 2 | JD16-1-1-1-6-4-4 | 1539.78 | 8.68 | 1473.80 | -5.48 | 1296.00 | -30.58 | ||
| 3 | 桂豇21-2 | 1655.90 | 8.68 | 1460.60 | -6.33 | 1398.75 | -30.58 | ||
| 4 | 冀豇1101-64-1-2 | 2219.19 | 56.63 | 2050.86 | 31.52 | 2334.00 | 25.01 | ||
| 5 | 品豇14 | 1469.90 | 3.75 | 1682.31 | 7.89 | 2540.25 | 36.06 | ||
| 6 | 中豇1号(CK) | 1416.84 | 0.00 | 1559.30 | 0.00 | 1867.00 | 0.00 | ||
3 讨论
在不同生态区进行新品种(系)联合鉴定,既能有效评估其环境适应性,也有助于新品种(系)的推广利用[9]。本研究结合各试验点、各生态区农艺性状测定及产量鉴定数据,对14份普通豇豆新品种(系)主要农艺性状在试验点及生态区间的变异特征展开分析,结果表明,主茎分枝数、单株荚数、单荚粒数及产量在各参试点间差异明显,各性状变异程度差异明显。其中主茎分枝数变异幅度最大,平均变异系数为51%;单株荚数变异系数为47%,位居其次;生育期变异程度最低,说明生育期受环境较小。其中单株荚数表现出较高的遗传变异既说明生态环境对品种(系)的影响,又体现不同品种(系)之间的差异。公丹等[11]在2021年对不同生态区中34个豇豆新品系的适应性鉴定分析中认为,豇豆单株荚数受环境影响较大。单荚粒数也是重要的产量相关性状,在2022-2023年的联合鉴定试验中,不同参试品种(系)主要农艺性状的差异明显,且与产量呈正相关。这与张忠武等[12]对41份长豇豆品种资源的农艺性状分析结果一致。由于产量因素受多因素影响,如果仅考虑单个性状进行分析,效果并不显著,黄志午等[13]对长豇豆种质资源的31个表型性状进行主成分、聚类等分析,结果表明单荚重和单株荚数是影响产量的主要因素。此外,王现丽等[14]在海南省三亚市对31份长豇豆的农艺性状研究表明,荚长的变异系数较小,百粒重的变异程度中等,与本试验不太一致。初步推测这种差异与本研究地域范围广泛有关,对比本试验中参试材料在南方播种区的数据发现,荚长和百粒重变异程度均较小,可以确定地域范围是造成这些差异的因素之一,但具体的影响因素还有待进一步考证。
本研究对产量的分析发现,冀豇1315-6-2-2、品豇14和桂豇21-2在不同生态区的各试验点都能成熟,且产量较高,居前3位,丰产性和稳定性较好,具有较高生态适应性;而有的品种(系)在大部分试验点产量较低,变异程度较大,丰产性、稳定性及适应性均较差,只能在个别试验点推广。
4 结论
本研究分析了不同普通豇豆新品种(系)的生态适应性、主要农艺性状的变异情况及生产试验结果,分别筛选出适合北方春播区种植的辽豇豆3号、冀豇1101-64-1-2和桂豇21-2;适合北方夏播区种植的冀豇1101-64-1-2、JD16-1-1-1-6-4-4和品豇14;适合南方区种植的品豇14和辽豇豆3号以及不同试验点产量居前3位的品种(系),可为不同生态区的普通豇豆生产提供品种选择。
参考文献
The genome of cowpea (Vigna unguiculata Walp.)
DOI:10.1111/tpj.2019.98.issue-5 URL [本文引用: 1]
Nutraceutical and pharmacological properties of vigna species
Cowpea: an overview on its nutritional facts and health benefits
DOI:10.1002/jsfa.9074
PMID:29656381
[本文引用: 1]

Cowpea (Vigna unguiculata) is a legume consumed as a high-quality plant protein source in many parts of the world. High protein and carbohydrate contents with a relatively low fat content and a complementary amino acid pattern to that of cereal grains make cowpea an important nutritional food in the human diet. Cowpea has gained more attention recently from consumers and researchers worldwide as a result of its exerted health beneficial properties, including anti-diabetic, anti-cancer, anti-hyperlipidemic, anti-inflammatory and anti-hypertensive properties. Among the mechanisms that have been proposed in the prevention of chronic diseases, the most proven are attributed to the presence of compounds such as soluble and insoluble dietary fiber, phytochemicals, and proteins and peptides in cowpea. However, studies on the anti-cancer and anti-inflammatory properties of cowpea have produced conflicting results. Some studies support a protective effect of cowpea on the progression of cancer and inflammation, whereas others did not reveal any. Because there are only a few studies addressing health-related effects of cowpea consumption, further studies in this area are suggested. In addition, despite the reported favorable effects of cowpea on diabetes, hyperlipidemia and hypertension, a long-term epidemiological study investigating the association between cowpea consumption and diabetes, cardiovascular disease and cancer is also recommended. © 2018 Society of Chemical Industry.© 2018 Society of Chemical Industry.
A review of the contribution of cowpea leaves to food and nutrition security in East Africa
DOI:10.1002/fsn3.v8.1 URL [本文引用: 1]
Comparison of phenolic compounds, carotenoids, amino acid composition, in vitro antioxidant and anti-diabetic activities in the leaves of seven cowpea (Vigna unguiculata) cultivars
DOI:10.3390/foods9091285
URL
[本文引用: 1]
Cowpea is a well-known nutrition rich African leafy vegetable that has potential to sustain food and nutrition insecurity in sub-Saharan Africa. Consumption of cowpea legumes is associated with reduced risk of type 2 diabetes mellitus. Therefore, the present study was designed to evaluate the (i) variation in phenolic metabolites in seven cowpea cultivars (VOP1, VOP2, VOP3, VOP4, VOP5, VOP7, and VOP8 using UHPLC coupled with high resolution Q-TOF-MS technique, (ii) in vitro antioxidant activity using ferric reducing/antioxidant capacity (FRAP) assay (iii) in vitro anti-diabetic effects and (iv) composition of carotenoids and amino acids of theses cowpea cultivars. The results of this study demonstrated that gentisic acid 5-O-glucoside, quercetin 3-(2G-xylosylrutinoside) and Quercetin 3-glucosyl-(1->2)-galactoside were highest in VOP1 VOP4 and VOP5, respectively. High inhibition (>50%) of α-glucosidase and α-amylase activities was shown by the leaf extracts (50 and 25 mg/mL) of VOP1 and VOP4. Cowpea cultivars VOP1 and VOP4 demonstrated the highest gene expression levels of regulation of glucose transporter GLUT4 in C2C12 skeletal muscle cells, similar to insulin. A positive correlation exited between the phenolic components and the inhibitory effect of antidiabetic enzymes and FRAP activity. Cytotoxic effect was not detected in vitro in any cowpea cultivar. Lutein (124.6 mg/100 g) and all-trans-beta-carotene (92.6 mg/100 g) levels were highest in VOP2 and VOP1, respectively. Cowpea cultivars VOP3 and VOP4 showed potential to fulfil the daily requirements of essential amino acids. Thus, based on this information, cowpea (leaves) genotypes/cultivars can be selected and propagated for the further development of supplementary foods or functional food ingredients.
豇豆种质资源农艺性状的相关性、主成分及聚类分析
DOI:10.11924/j.issn.1000-6850.casb16110030
[本文引用: 1]
为了给豇豆育种中品种资源的合理利用提供依据,对41份豇豆品种资源15项主要农艺性状进行相关性、主成分和聚类分析。结果表明,枯萎病发生程度的变异系数最大,与豇豆产量关系密切的单荚重和单株嫩荚数2个农艺性状,与株型、嫩荚长、单株花序数和单荚种子粒数都呈现显著正相关,单株嫩荚数与开花期、叶宽和单株分枝数呈现显著负相关。15个主要农艺性状可以归纳为5个主成分,第1主成分包括株型、初花节位、嫩荚长、单荚重、单荚种子粒数、单株花序数、单株嫩荚数和单株分枝数;第2主成分包括开花期、叶长和叶宽;第3主成分包括种皮颜色和嫩荚宽;第4主成分包括嫩荚颜色;第5主成分包括枯萎病发生程度。41份豇豆种质资源在遗传距离为25处分为2大类,在遗传距离为15处分为Ⅰ、Ⅱ、Ⅲ类,其中第Ⅰ类的品种优势明显,具有较好的应用前景。
