


鲜薯产量及花青素含量直接关系到紫薯的生理保健功能和开发利用效益,是紫薯的重要物质基础和评定依据。目前,国内外有关紫薯薯块花青素含量的积累趋势报道相对较少。马佩勇等[8]研究表明,紫薯花青素总量与块根干物质总量在整个块根膨大期都表现为持续性增加,紫薯花青素含量与地上部分质量指标呈显著负相关,与块根干物质含量指标呈显著正相关。傅玉凡等[9]研究了13个紫薯品种花青素含量在栽插后20~140 d的变化,根据积累规律把花青素变化类型分为3种类型:缓慢增加型、曲折上升型和波动变化型。Yoshinaga等[10]根据块根花青素含量的高低将其研究的10个紫薯品种分为花青素含量高和低2类,且各品种花青素含量的积累规律都表现为同一种类型,即栽后21~42 d的快速增加阶段、42~84 d的小幅变动阶段及84~119 d的略微增加阶段的变化类型。目前,关于不同紫薯品种在不同施肥条件下及不同生育期花青素的积累规律的报道较少,因此,本研究通过选取花青素含量高、中、低的3个紫薯品种,在不同肥料浓度配比条件下研究不同紫薯品种花青素积累的动态发展规律以及干物质积累、产量变化规律,探索有益于紫薯花青素积累和鲜薯产量提高的肥料配比条件,为紫薯开发及栽培利用提供科学依据。
1 材料与方法
1.1 试验材料
试验于2023年5-10月在重庆市万州区重庆三峡农业科学院甘宁试验示范基地进行。试验材料由重庆三峡农业科学院提供。选用3个花青素含量高、中、低的紫薯品种万紫薯56、宁紫薯1号、万紫薯16号为试验材料,其鲜薯花青素含量分别为66.86、22.41和9.51 mg/100g。试验肥料选用平衡复合肥(N:P2O5:K2O=15:15:15,总有效成分≥45%,九禾股份有限公司),高磷复合肥(N:P2O5: K2O=16:32:5,总有效成分≥53%,湖北山泉生物科技有限公司),硫酸钾肥(含K2O有效成分≥52%,国投新疆罗布泊钾盐有限责任公司)。肥料用量按N:P2O5:K2O有效成分总量337.50 kg/hm2折算。
1.2 试验设计
试验采用紫薯品种(A因素)和氮、磷、钾肥料配比(B因素)双因素随机区组设计,3次重复。A因素分为万紫薯56(A1)、宁紫薯1号(A2)和万紫薯16号(A3)。B因素N:P2O5:K2O肥料配比,分为1:1:1(B1,均衡配比)、1:2:1(B2,高磷配比)和1:1:2(B3,高钾配比),总有效含量达到45.00%。B1处理采用平衡复合肥750.00 kg/hm2;B2处理采用高磷复合肥527.40 kg/hm2+硫酸钾111.60 kg/hm2混合;B3处理采用平衡复合肥562.50 kg/hm2+硫酸钾肥162.30 kg/hm2混合。小区面积16.0 m2(长3.2 m、宽5.0 m),4行区,起垄栽插,单垄单行,栽插密度6.0×10⁴株/hm2,甘薯株距21 cm,行距80 cm。肥料作为基肥一次性施入,生育期内不追肥。5月26日栽插,10月14日收获,生育期140 d。田间管理措施同大田生产。
1.3 测定项目与方法
栽插后60、80、100、120和140 d每小区取样2株代表性整株样品,分别称量地上部藤蔓和地下部薯块鲜重,并采用烘干法测定其干重;采用柠檬酸―磷酸氢二钠缓冲液法测定薯块花青素含量;收获时随机连续选取10株,调查大薯(250 g以上)、中薯(50~250 g)、小薯(50 g以下)薯块数量和重量,计算商品薯率,商品薯率(%)=(大薯重+中薯重)/(大薯重+中薯重+小薯重)×100。
1.4 数据处理
采用Excel和DPS 7.05数据处理系统中LSD法统计分析试验数据。
2 结果与分析
2.1 不同氮、磷、钾配比在不同生育期对紫薯单株藤蔓鲜重、干重的影响
从单株藤蔓鲜重上看,在不同氮、磷、钾配比下3个紫薯品种平均藤蔓鲜重表现为B1>B2、B3,且60~100 d时B2>B3,100~140 d时B3>B2,在总施肥量一致的前提下,高磷或高钾就意味着施氮水平下降,说明施磷或施钾处理都不如高氮对地上藤蔓的促进作用,但施钾处理最终对藤蔓鲜重的促进作用与均衡条件相当,施磷处理促进作用稍弱(图1)。
图1
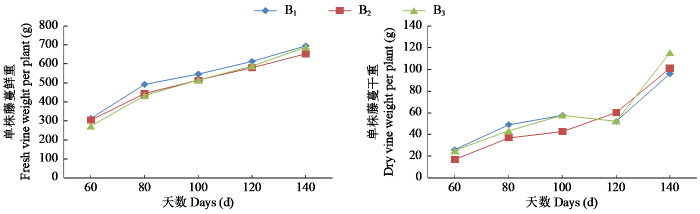
图1
不同氮、磷、钾配比下不同生育期3个紫薯品种平均单株藤蔓鲜重、干重变化
Fig.1
Changes in average fresh and dry vine weight per plant of three purple sweetpotato varieties at different growth stages under different N, P, and K ratios
从单株藤蔓干重上看,在不同氮、磷、钾配比下表现为60~80 d时B1>B2>B3,从80~140 d有一个浮动变化的过程,最终表现为B3>B2>B1,由此可见,施磷或施钾处理都有利于地上藤蔓干重的增加,且在整个生育期内基本都表现为B3>B2。
2.2 不同氮、磷、钾配比在不同生育期对紫薯单株薯块鲜重、干重的影响
从单株鲜薯鲜重上看,在不同氮、磷、钾配比下3个不同紫薯品种平均单株鲜薯鲜重从60~100 d表现为B1>B2>B3的趋势,从100~140 d则呈现B2>B1>B3的趋势,总体上表现为施磷(B2处理)前期促进甘薯产量增加作用要低于B1处理,但后期促进作用提高,要高于B1和B3处理。
从单株鲜薯干重上看,在不同氮、磷、钾配比下紫薯单株鲜薯干重趋势基本与单株鲜薯鲜重类似,基本呈现出前期B1>B2>B3,之后出现波动,最终呈现出B2>B3>B1的趋势,该结果与单株藤蔓干重的结果是一致的(图2)。
图2
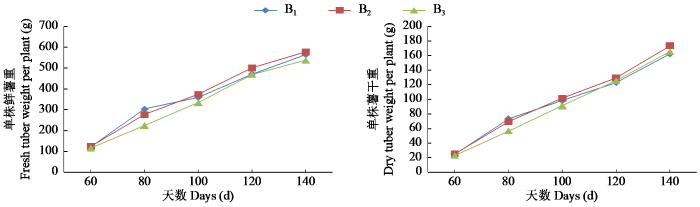
图2
不同氮、磷、钾配比下不同生育期3个紫薯品种平均单株薯块鲜重、干重变化
Fig.2
Changes in average tuber fresh and dry weight per plant in three purple sweetpotato varieties at different growth stages under different N, P, and K ratios
2.3 不同氮、磷、钾配比在收获期对紫薯产量的影响
从小区藤蔓产量上看,同一紫薯品种在不同氮磷、钾、配比下藤蔓产量都没有显著差异,但在施磷(B2处理)条件下,小区藤蔓产量在3个紫薯品种中为最低,A1和A3品种在施钾条件(B3处理)下藤蔓产量最高,而A2则是在均衡配比(B1处理)下藤蔓产量最高(表1)。
表1 不同氮、磷、钾配比下3个紫薯品种产量分析
Table 1
| 处理 Treatment | 小区藤蔓产量 Vine yield per plot (kg/16 m2) | 商品薯率 Commercial potato rate (%) | 小区鲜薯产量 Fresh tuber yield per plot (kg/16 m2) | 折合产量 Converted yield (t/hm2) |
|---|---|---|---|---|
| A1B1 | 29.91±5.89aA | 92.78±1.43aAB | 54.07±0.83abAB | 33.81 |
| A1B2 | 26.00±5.67abAB | 92.89±1.45aAB | 55.52±2.53abA | 34.72 |
| A1B3 | 32.17±3.17aA | 89.24±2.9bcBCD | 51.39±0.76cBC | 32.13 |
| A2B1 | 19.58±4.88bcB | 84.99±1.56dD | 53.36±0.48bcAB | 33.37 |
| A2B2 | 17.21±1.74cB | 88.23±0.45cCD | 54.34±0.67abAB | 33.98 |
| A2B3 | 18.99±1.15cB | 86.85±2.76cdD | 55.24±1.9abA | 34.54 |
| A3B1 | 19.97±2.54bcB | 94.48±1.7aA | 54.93±0.69abA | 34.35 |
| A3B2 | 19.31±1.26bcB | 91.50±0.85abABC | 56.29±1.77aA | 35.20 |
| A3B3 | 19.99±4.1bcB | 86.64±2.59cdD | 48.15±0.79dC | 30.11 |
| A | 20.35** | 18.22** | 1.59 | |
| B | 1.35 | 8.99** | 16.64** | |
| A×B | 0.43 | 5.19** | 9.76** |
不同小写字母表示在P < 0.05水平差异显著,不同大写字母表示在P < 0.01水平差异极显著,“*”和“**”分别表示在P < 0.05和P < 0.01水平显著和极显著差异,下同。
Different lowercase letters indicate significant differences at P < 0.05 level, different uppercase letters indicate extremely significant differences at P < 0.01 level.“*”and“**”indicate significant and extremely significant differences at P < 0.05 and P < 0.01 levels, respectively, the same below.
从商品薯率上看,B2处理对A1、A2、A3同一品种之间商品薯率影响都不显著;B3不利于A1和A3品种商品薯率的提高。不同的紫薯品种、不同的施肥方式以及2个因素的交互作用对紫薯商品薯率的影响都存在极显著差异。
从鲜薯产量上看,3个紫薯品种在不同氮、磷、钾配比下的平均鲜薯重B1为33.84 t/hm2,B2为34.63 t/hm2,B3为32.26 t/hm2,表现为B2>B1>B3,且A1、A3品种在B3与B1处理间都表现为显著差异,甚至在A3品种表现为极显著差异,而3个品种在B2和B1处理下差异都不显著。而从折合产量上看,A1、A3都是在B2处理下产量最高,A2则是在B3处理下产量最高。
2.4 不同氮、磷、钾配比对紫薯花青素积累量的影响
从花青素的积累情况来看,不同氮、磷、钾配比下3个紫薯品种平均花青素积累量变化趋势B1、B2和B3处理基本重合,但B2和B3处理花青素含量明显高于B1处理。B2、B3相比B1处理,60~100 d花青素的积累量呈现缓慢增长的趋势,100~ 120 d呈现急剧增长,120~140 d增长趋势变缓,但相比60~100 d积累速率是提升的。而在140 d时,花青素的积累量表现为B2>B3>B1,说明B2和B3处理都能提高紫薯花青薯的积累,且B2处理对花青素的积累更强,所以增施磷肥和钾肥都能提高紫薯花青素的产量(图3)。
图3
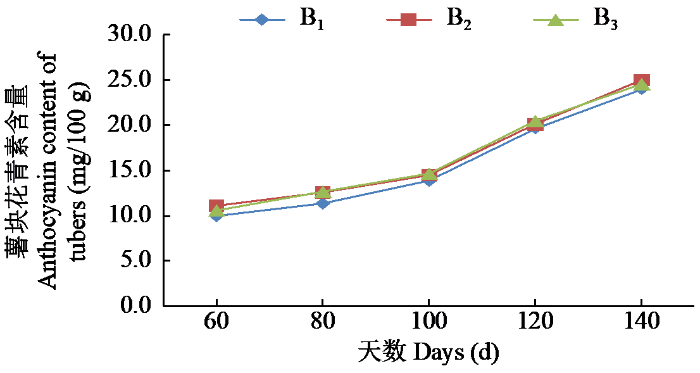
图3
不同氮、磷、钾配比下不同生育期3个紫薯品种薯块平均花青素含量变化
Fig.3
Changes in average anthocyanin content of tuber in three purple sweetpotato varieties at different growth stages under different N, P, and K ratios
从花青素含量上看,不同紫薯品种在不同氮、磷、钾配比下呈现基本一致的趋势,A1和A3品种的花青素含量都表现出B2>B3>B1的趋势,而A2花青素含量B1、B2和B3处理表现为基本重合的趋势。在不同肥料配比处理条件下,除120 d外,A1花青素含量在B2与B1处理间均呈现极显著差异;A2花青素含量在60~120 d时,B2与B1处理间均表现为差异不显著,在140 d时呈现显著差异,而B3与B1处理间在60~80 d表现为差异显著,100~140 d表现为差异不显著;A3品种在3个不同肥料配比的不同生育期内,花青素含量差异都不显著(表2)。
表2 不同氮、磷、钾配比下不同时期紫薯花青素含量
Table 2
| 处理Treatment | 60 d | 80 d | 100 d | 120 d | 140 d |
|---|---|---|---|---|---|
| A1B1 | 16.34±0.54bB | 18.49±1.02bB | 22.16±0.69bB | 36.76±0.41bB | 42.88±0.24bB |
| A1B2 | 18.91±1.78aA | 20.92±0.73aA | 24.44±0.52aA | 37.91±0.78aAB | 45.13±1.70aA |
| A1B3 | 16.24±0.92bB | 20.23±0.85aAB | 24.10±1.01aA | 38.45±1.09aA | 43.88±0.45bAB |
| A2B1 | 8.63±0.52dD | 10.00±1.74dC | 12.09±0.53cdC | 13.64±0.45cC | 16.60±0.39dC |
| A2B2 | 9.29±0.81dCD | 10.72±0.44cdC | 11.38±0.59dC | 13.74±0.31cC | 17.90±0.62cC |
| A2B3 | 10.72±0.42cC | 11.80±0.40bB | 12.64±0.66cC | 14.01±0.27cC | 17.66±0.25cdC |
| A3B1 | 4.98±0.58eE | 5.57±1.10eD | 7.43±0.58eD | 8.52±0.54dD | 12.47±0.99eD |
| A3B2 | 5.03±0.40eE | 6.00±0.38eD | 7.55±0.54eD | 8.58±0.56dD | 12.00±0.80eD |
| A3B3 | 4.82±0.99eE | 6.02±0.45eD | 7.27±0.26eD | 9.00±0.28dD | 12.05±0.19eD |
| A | 718.10** | 655.22** | 1443.80** | 5940.98** | 5184.06** |
| B | 5.68* | 6.93** | 3.32 | 4.42* | 4.71* |
| A×B | 7.98** | 1.82 | 5.02** | 1.29 | 3.04* |
虽然不同紫薯品种的花青素含量差异很大,但随着生育期的增加,花青素含量均表现出增加的趋势,紫薯花青素的积累情况与紫薯的品种也存在极显著差异,但总体上,B2和B3处理有利于紫薯花青素含量的增加,且B2处理的促进作用更强,花青素含量的变化在60、120和140 d时与施肥方式存在显著差异,特别是在100 d时2个因素交互作用存在极显著差异。
3 讨论
唐忠厚等[11]研究表明,施磷能够显著提高甘薯产量,生产中可以针对不同甘薯品种的需肥特点调整施磷量,配施氮肥和钾肥可以发挥甘薯的高产特性。本研究中A1、A3品种都是B2条件下鲜薯产量最高。杨庆飞等[12]研究表明,适量施钾能够提高甘薯产量,但施钾肥对提高甘薯的商品薯率没有显著作用。本试验表明B3(高钾配比)没有提高A1和A3品种的商品薯率,但却提高了A2的商品薯率,这与杨庆飞等[12]的研究结果有所不同,推测可能是因为参试年份收获季节雨水过多,导致收获时大量的烂薯坏薯不仅影响了最终的甘薯产量,也导致收获的紫薯大、中、小薯比例失衡,而A2(宁紫薯1号)耐涝能力相比A1、A3品种相对较弱,说明与参试品种存在一定的关系,最终导致B3条件下宁紫薯1号的产量最低,所以施钾对紫薯产量的影响还需要进一步开展试验进行验证。
卢刚等[13]研究表明,适当施磷能够提高甘薯的商品薯率,同时适量施磷肥有利于块根产量的形成,这与本研究一致,尽管遇到极端天气的情况下,施磷处理还是提高了地下鲜薯产量,也表明适量施磷可能确实提高了紫薯的抗性,A2品种鲜薯产量表现为B2>B1>B3。而过量施磷肥会造成茎蔓徒长,不利于同化物向块根运输,影响结薯数进而不利于产量的增加,但不会造成减产,本研究中A1、A3和A2品种地上藤蔓产量都没有表现出B2>B1、B3,说明增施的磷肥没有过量,反而有利于A1和A3品种地下部分鲜薯产量提高。
本研究发现,A1花青素含量在B2条件下显著高于B1均衡施肥和B3高钾条件,而A3在3种施肥方式下花青素含量差异不显著,A2花青素含量在B2处理下显著高于B1处理,与B3处理差异不显著;其次增施磷肥有利于紫薯鲜薯产量的提高;而增施钾肥对紫薯产量的影响不同,A1、A3鲜薯产量在B2和B3处理下显著低于B1处理;而A2鲜薯产量在B3条件下高于B1和B2,但差异不明显;而A1、A3鲜薯产量在B2和B3下显著低于B1处理,该结果因部分紫薯品种自身特性或受气候、地理等条件因素的影响与常规不一致,可能需通过进一步试验验证。
4 结论
不同氮、磷、钾配比下紫甘薯的花青素积累规律表现为B2(高磷配比)>B3(高钾配比)>B1(均衡配比),且B2和B3的趋势基本重合,都有利于紫薯花青素的积累,但相比B3处理,B2处理在60和140 d时对花青素的积累作用更强。不同氮、磷、钾配比对紫甘薯鲜薯产量的影响表现为B2>B1>B3,且B3与B1在万紫薯56、万紫薯16号品种中表现为差异极显著,在宁紫薯1号中表现为差异不显著。氮磷钾配比1:2:1处理3个紫薯品种的花青素含量显著高于其他条件,同时万紫薯56和万紫薯16号产量达到最高,而宁紫薯1号产量相比均衡配比条件下也有提高。增施磷肥和钾肥均能提高紫薯的花青素含量,磷钾肥配施与单施磷肥、单施钾肥相比,花青素含量更高。
参考文献
Direct absorption of acylated anthocyanin in purple-fleshed sweet potato into rats
PMID:11879056

Absorption of acylated anthocyanins in purple-fleshed sweet potato (Ipomoea batatas cv. Ayamurasaki) in rats was studied to obtain evidence that the acylated anthocyanins themselves could exert a physiological function in vivo. Peonidin 3-caffeoylsophoroside-5-glucoside (Pn 3-Caf*sop-5-glc) in purple-fleshed sweet potato was directly absorbed into rat and present as an intact acylated form in plasma. After oral administration of the purple-fleshed sweet potato anthocyanin (PSA) concentrate containing 38.9 micromol of Pn 3-Caf*sop-5-glc/kg of body weight, Pn 3-Caf*sop-5-glc was detected in the plasma, and the C(max) value and t(max) were estimated as 50.0 +/- 6.8 nmol/Lof plasma and 30 min, respectively. Furthermore, the plasma antioxidant capacity was significantly elevated from 58.0 +/- 12.0 to 89.2 +/- 6.8 micromol of Trolox equivalent/L of plasma 30 min after the administration of the PSA concentrate.
Antimutagenicity of deacylated anthocyanins in purple-fleshed sweetpotato
DOI:10.1271/bbb.65.1652 URL [本文引用: 1]
Antioxidative activity of anthocyanins from purple sweet potato, Ipomoera batatas cultivar Ayamurasaki
DOI:10.1271/bbb.69.979 URL [本文引用: 1]
Sweet potato: a review of its past, present, and future role in human nutrition
The overall objective of this chapter is to review the past, present, and future role of the sweet potato (Ipomoea batatas [L.] Lam) in human nutrition. Specifically, the chapter describes the role of the sweet potato in human diets; outlines the biochemical and nutritional composition of the sweet potato with emphasis on its beta-carotene and anthocyanin contents; highlights sweet potato utilization, and its potential as value-added products in human food systems; and demonstrates the potential of the sweet potato in the African context. Early records have indicated that the sweet potato is a staple food source for many indigenous populations in Central and South Americas, Ryukyu Island, Africa, the Caribbean, the Maori people, Hawaiians, and Papua New Guineans. Protein contents of sweet potato leaves and roots range from 4.0% to 27.0% and 1.0% to 9.0%, respectively. The sweet potato could be considered as an excellent novel source of natural health-promoting compounds, such as beta-carotene and anthocyanins, for the functional food market. Also, the high concentration of anthocyanin and beta-carotene in sweet potato, combined with the high stability of the color extract make it a promising and healthier alternative to synthetic coloring agents in food systems. Starch and flour processing from sweet potato can create new economic and employment activities for farmers and rural households, and can add nutritional value to food systems. Repositioning sweet potato production and its potential for value-added products will contribute substantially to utilizing its benefits and many uses in human food systems. Multidisciplinary, integrated research and development activities aimed at improving production, storage, postharvest and processing technologies, and quality of the sweet potato and its potential value-added products are critical issues, which should be addressed globally.
UV-B-induced photomorphogenesis in Arabidopsis thaliana
DOI:10.1046/j.1365-313x.1998.00246.x
URL
[本文引用: 1]
Relatively little is known about the types of photomorphogenic responses and signal transduction pathways that plants employ in response to ultraviolet‐B (UV‐B, 290–320 nm) radiation. In wild‐type Arabidopsis seedlings, hypocotyl growth inhibition and cotyledon expansion were both reproducibly promoted by continuous UV‐B. The fluence rate response of hypocotyl elongation was examined and showed a biphasic response. Whereas photomorphogenic responses were observed at low doses, higher fluences resulted in damage symptoms. In support of our theory that photomorphogenesis, but not damage, occurs at low doses of UV‐B, photomorphogenic responses of UV‐B sensitive mutants were indistinguishable from wild‐type plants at the low dose. This allowed us to examine UV‐B‐induced photomorphogenesis in photoreceptor deficient plants and constitutive photomorphogenic mutants. The cry1 cryptochrome structural gene mutant, and phytochrome deficient hy1, phyA and phyB mutant seedlings resembled wild‐type seedlings, while phyA/phyB double mutants were less sensitive to the photomorphogenic effects of UV‐B. These results suggest that either phyA or phyB is required for UV‐B‐induced photomorphogenesis. The constitutive photomorphogenic mutants cop1 and det1 did not show significant inhibition of hypocotyl growth in response to UV‐B, while det2 was strongly affected by UV‐B irradiation. This suggests that COP1 and DET1 work downstream of the UV‐B signaling pathway.
Changes in anthocyanin content and composition of developing storage root of purple- fleshed sweet potato (Ipomoea batatas (L.) Lam)
DOI:10.1270/jsbbs.50.59 URL [本文引用: 1]
