作物杂志,2022, 第1期: 50–55 doi: 10.16035/j.issn.1001-7283.2022.01.007

• 遗传育种·种质资源·生物技术 • 上一篇    下一篇

浙江红麻资源表型性状的遗传多样性分析

李文略(), 陈常理, 骆霞虹, 柳婷婷, 安霞(), 金关荣, 朱关林   

  1. 浙江省农业科学院浙江省园林植物与花卉研究所(浙江省萧山棉麻研究所),311251,浙江杭州
  • 收稿日期:2021-03-04 修回日期:2021-04-26 出版日期:2022-02-15 发布日期:2022-02-16
  • 通讯作者: 安霞
  • 作者简介:李文略,主要从事麻类等特色经济作物资源收集和利用研究,E-mail: kobe1924@163.com
  • 基金资助:
    国家重点研发计划政府间国际科技创新合作重点专项(2017YFE0195300);国家自然科学基金(31801406);财政部和农业农村部:国家麻类现代农业产业技术体系(CARS-16-S05)

Genetic Diversity Analysis of Phenotypic Characteristics of Kenaf Resources in Zhejiang Province

Li Wenlue(), Chen Changli, Luo Xiahong, Liu Tingting, An Xia(), Jin Guanrong, Zhu Guanlin   

  1. Zhejiang Institute of Landscape Plants and Flowers, Zhejiang Academy of Agricultural Sciences (Zhejiang Xiaoshan Institute of Cotton and Bast Fiber Crops), Hangzhou 311251, Zhejiang, China
  • Received:2021-03-04 Revised:2021-04-26 Online:2022-02-15 Published:2022-02-16
  • Contact: An Xia

摘要:

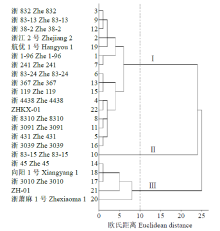
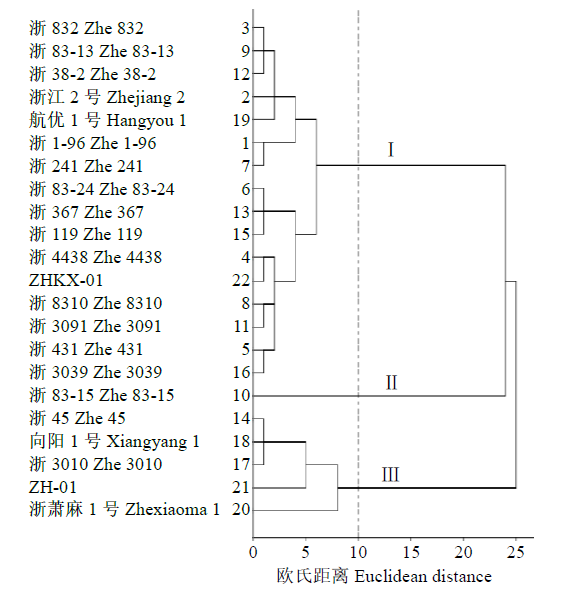
为充分了解和有效利用已收集的红麻资源,以22份浙江红麻种质为材料,采用随机区组试验,2年重复,对其16个产量和品质性状进行系统调查和分析。结果表明,22份浙江红麻资源变异系数范围为3.49%~20.10%,以纤维强力变异系数最大。主成分分析表明,前3个主成分(分别为单株产量因子、群体产量因子和纤维品质因子)提供了原始性状80.753%的信息;欧氏距离为10时,可把22份浙江红麻资源分为3类,其中I类为高产型,Ⅱ类具有高纤维强力特征;隶属函数法分析显示,浙1-96、航优1号、ZHKX-01和浙4438等I类资源排名靠前,具备选育高产种质的潜力。

关键词: 红麻, 表型性状, 遗传多样性, 主成分分析, 聚类分析

Abstract:

In order to fully gain knowledge and effectively make use of the collected kenaf resources, 22 kenaf germplasms collected from Zhejiang province were systematically investigated and analyzed based on 16 yield and quality characteristics. The results showed that there was great variation among 22 Zhejiang kenaf resources, and the coefficient variation ranged from 3.49%-20.10%, and the largest coefficient variation was fibre strength. Principal component analysis indicated that the first three principal components were individual yield factor, population yield factor, fibre quality factor, which provided 80.753% information of original characters. The total of 22 Zhejiang kenaf resources could be divided into three categories while euclidean distance was 10, among which the first group was high-yield type, and the second group was high fibre strength. Subordinate function analysis showed that Zhe 1-96, Hangyou 1, ZHKX-01 and Zhe 4438 in the the first group had the potential of breeding high-yield germplasm.

Key words: Kenaf, Phenotypic characters, Genetic diversity, Principal component analysis, Cluster analysis

表1

供试红麻品种(系)及来源

编号
Code
品种(系)
Variety (line)
来源
Origin
编号
Code
品种(系)
Variety (line)
来源
Origin
1 浙1-96 杭州市 12 浙38-2 杭州市
2 浙江2号 杭州市 13 浙367 杭州市
3 浙832 杭州市 14 浙45 杭州市
4 浙4438 杭州市 15 浙119 杭州市
5 浙431 杭州市 16 浙3039 杭州市
6 浙83-24 杭州市 17 浙3010 杭州市
7 浙241 杭州市 18 向阳1号 杭州市
8 浙8310 杭州市 19 航优1号 杭州市
9 浙83-13 杭州市 20 浙萧麻1号 杭州市
10 浙83-15 杭州市 21 ZH-01 杭州市
11 浙3091 杭州市 22 ZHKX-01 杭州市

表2

浙江红麻资源表型性状的描述性统计分析

性状
Trait
最大值
Max.
最小值
Min.
极差
Range
平均值
Mean
标准差
Standard deviation
变异系数
Coefficient of variation (%)
株高Plant height (cm) 402.93 346.00 56.93 377.64 13.18 3.49
茎粗Stem diameter (mm) 18.87 15.02 3.85 17.19 0.99 5.74
鲜皮厚Fresh bark thickness (mm) 1.22 0.89 0.33 1.05 0.09 8.22
单株鲜茎重Fresh stem weight per plant (g) 550.50 316.00 234.50 451.05 60.10 13.33
单株鲜皮重Fresh bark weight per plant (g) 257.00 147.75 109.25 209.85 28.83 13.74
单株干皮重Dry bark weight per plant (g) 49.50 28.50 21.00 40.97 5.31 12.96
单株纤维重Fibre weight per plant (g) 27.04 15.55 11.49 21.56 2.80 12.99
鲜茎干皮率Dry bark to fresh stem (%) 9.93 8.39 1.55 9.10 0.42 4.57
干皮精洗率Fibre ratio to dry bark (%) 57.30 48.21 9.09 52.69 2.14 4.07
单株鲜重Fresh weight per plant (g) 630.25 351.25 279.00 517.23 70.98 13.72
干皮产量Yield of dry bark (g) 8.28 4.17 4.11 6.37 1.04 16.39
精麻产量Yield of fibre (t/hm2) 4.52 2.23 2.29 3.36 0.56 16.58
生物量Biological yield (t/hm2) 25.98 12.75 13.23 19.62 3.42 17.45
有效株数Effective plant number (×104/hm2) 18.17 11.84 6.33 15.38 1.58 10.26
纤维支数Fibre count (g/m) 259.00 226.00 33.00 239.14 8.80 3.68
纤维强力Fibre strength (N) 452.00 205.00 247.00 273.82 55.02 20.10

表3

浙江红麻资源主成分分析前3个主成分的因子载荷矩阵及特征值描述

性状
Trait
主成分Principal component
1 2 3
单株鲜茎重Fresh stem weight per plant 0.983 0.095 0.068
单株鲜重Fresh weight per plant 0.983 0.075 0.015
单株鲜皮重Fresh bark weight per plant 0.980 0.005 0.074
单株干皮重Dry bark weight per plant 0.945 0.206 -0.110
单株纤维重Fibre weight per plant 0.924 0.220 0.094
茎粗Stem diameter 0.929 0.058 0.073
生物量Biological yield 0.650 0.746 -0.013
鲜皮厚Fresh bark thickness 0.838 -0.013 -0.028
精麻产量Yield of fibre 0.639 0.730 0.063
干皮产量Yield of dry bark 0.659 0.732 -0.100
株高Plant height 0.370 0.684 0.484
有效株数Effective plant number -0.222 0.884 0.013
纤维强力Fibre strength 0.063 0.099 0.760
纤维支数Fibre count -0.163 0.388 0.476
干皮精洗率Fibre ratio to dry bark -0.104 0.038 0.695
鲜茎干皮率Dry bark to fresh stem -0.274 0.300 -0.580
特征值Eigenvalue 8.543 2.604 1.774
贡献率Contribution rate (%) 53.391 16.273 11.089
累计贡献率
Cumulative contribution rate (%)
53.391
69.664
80.753

图1

基于产量和品质性状构建的浙江红麻种质系统聚类图

表4

3类红麻资源主要性状特征

性状
Trait
Ⅰ(n=72.7%) Ⅱ(n=4.6%) Ⅲ (n=22.7%)
平均值Average 范围Range 平均值Average 范围Range 平均值Average 范围Range
株高Plant height (cm) 380.41 359.35~402.93 382.05 367.88 346.00~385.95
茎粗Stem diameter (mm) 17.66 16.74~18.87 17.17 15.69 15.02~16.06
鲜皮厚Fresh bark thickness (mm) 1.09 1.00~1.22 0.98 0.94 0.89~0.98
单株鲜茎重Fresh stem weight per plant (g) 480.95 431.25~550.50 432.25 359.10 316.00~381.25
单株鲜皮重Fresh bark weight per plant (g) 223.59 190.00~257.00 197.50 168.35 147.75~177.00
单株干皮重Dry bark weight per plant (g) 43.71 40.00~49.50 36.13 33.15 28.50~35.63
单株纤维重Fibre weight per plant (g) 22.91 21.03~27.04 20.25 17.53 15.55~19.14
鲜茎干皮率Dry bark to fresh stem (%) 9.09 8.39~9.93 8.39 9.30 9.04~9.68
干皮精洗率Fibre ratio to dry bark (%) 52.40 48.21~57.30 56.05 52.94 49.18~54.55
单株鲜重Fresh weight per plant (g) 553.41 511.25~630.25 483.50 408.20 351.25~431.75
干皮产量Yield of dry bark (g) 6.82 5.54~8.28 5.30 5.18 4.17~6.07
精麻产量Yield of fibre (t/hm2) 3.57 2.86~4.52 2.97 2.74 2.23~3.26
生物量Biological yield (t/hm2) 21.08 17.77~25.98 16.56 15.57 12.75~17.85
有效株数Effective plant number (×104/hm2) 15.37 11.84~18.17 14.57 15.56 12.30~17.12
纤维支数Fibre count (g/m) 239.25 226.00~251.00 242.00 238.20 226.00~259.00
纤维强力Fibre strength (N) 271.44 212.00~329.00 452.00 245.80 205.00~331.00

表5

浙江红麻资源16个指标的隶属函数值分析

品种(系)
Variety (line)
PH SD FBT FSW FBW DBW FW1 DBFS FRD FW2 TDBW TFW TBY EN FC FS 平均
Average
排序
Ranking
1 0.956 1.000 0.864 1.000 1.000 1.000 1.000 0.349 0.705 1.000 1.000 1.000 0.948 0.698 0.455 0.259 0.827 1
2 0.712 0.813 0.560 0.855 0.826 0.875 0.829 0.384 0.581 0.861 0.908 0.871 0.925 0.706 0.030 0.170 0.682 3
3 0.527 0.581 0.565 0.732 0.728 0.750 0.504 0.392 0.000 0.731 0.539 0.370 0.491 0.352 0.636 0.255 0.510 16
4 0.682 0.598 0.688 0.559 0.611 0.548 0.642 0.345 1.000 0.573 0.525 0.609 0.629 0.572 0.606 0.445 0.602 5
5 0.437 0.445 0.620 0.587 0.465 0.792 0.754 0.984 0.599 0.645 0.453 0.439 0.439 0.228 0.636 0.328 0.553 8
6 0.437 0.619 0.357 0.617 0.572 0.613 0.563 0.324 0.549 0.642 0.561 0.530 0.544 0.597 0.667 0.028 0.514 14
7 0.602 0.746 0.881 0.909 0.938 0.869 0.751 0.244 0.386 0.961 0.333 0.277 0.379 0.000 0.394 0.283 0.560 7
8 0.563 0.773 0.807 0.677 0.753 0.738 0.651 0.534 0.454 0.680 0.652 0.591 0.525 0.488 0.000 0.470 0.585 6
9 0.459 0.937 0.544 0.765 0.785 0.637 0.584 0.002 0.542 0.760 0.547 0.515 0.518 0.503 0.121 0.283 0.531 12
10 0.633 0.556 0.286 0.496 0.455 0.363 0.409 0.000 0.862 0.474 0.275 0.323 0.288 0.430 0.485 1.000 0.459 17
11 0.670 0.643 0.622 0.672 0.725 0.589 0.492 0.150 0.400 0.673 0.495 0.430 0.445 0.527 0.303 0.352 0.512 15
12 0.550 0.601 0.447 0.752 0.744 0.720 0.592 0.298 0.332 0.764 0.597 0.507 0.601 0.519 0.424 0.105 0.535 11
13 0.235 0.616 1.000 0.612 0.636 0.601 0.482 0.378 0.338 0.599 0.703 0.606 0.604 0.830 0.303 0.065 0.538 10
14 0.202 0.269 0.107 0.224 0.217 0.262 0.102 0.534 0.106 0.246 0.205 0.102 0.165 0.490 0.182 0.000 0.213 21
15 0.668 0.551 0.631 0.562 0.487 0.607 0.554 0.579 0.540 0.593 0.591 0.556 0.567 0.602 0.364 0.154 0.538 9
16 0.378 0.838 0.407 0.636 0.616 0.690 0.554 0.643 0.302 0.691 0.580 0.484 0.559 0.462 0.303 0.235 0.524 13
17 0.473 0.188 0.268 0.278 0.256 0.339 0.312 0.711 0.605 0.245 0.463 0.450 0.337 0.710 0.061 0.126 0.364 19
18 0.000 0.201 0.276 0.180 0.268 0.268 0.236 0.837 0.582 0.289 0.000 0.000 0.000 0.072 0.000 0.073 0.205 22
19 1.000 0.620 0.560 0.827 0.835 0.893 0.819 0.639 0.506 0.832 0.953 0.890 1.000 0.833 0.758 0.368 0.771 2
20 0.702 0.208 0.170 0.237 0.201 0.238 0.215 0.421 0.611 0.242 0.381 0.372 0.385 0.833 1.000 0.510 0.420 18
21 0.544 0.000 0.000 0.000 0.000 0.000 0.000 0.431 0.697 0.000 0.183 0.198 0.179 0.834 0.606 0.117 0.237 20
22 0.797 0.577 0.393 0.491 0.387 0.667 0.477 1.000 0.139 0.587 0.865 0.694 0.906 1.000 0.424 0.502 0.619 4
[1] 粟建光, 戴志刚. 红麻种质资源描述规范和数据标准. 北京: 中国农业出版社, 2005.
[2] 刘倩, 戴志刚, 陈基权, 等. 应用SRAP分子标记构建红麻种质资源分子身份证. 中国农业科学, 2013, 46(10):1974-1983.
[3] 程舟, 鲛岛一彦, 陈家宽. 日本的红麻研究、开发和应用. 中国麻业, 2001, 23(3):16-24.
[4] 陶爱芬, 祁建民, 林培青, 等. 红麻优异种质产量和品质性状主成分聚类分析与综合评价. 中国农业科学, 2008, 41(9):2859-2867.
[5] Cheng Z, Yoshito O, Kazuhiko S, et al. Selection of plant population of kenaf (Hibiscus cannabinus L.) as a papermaking raw material on arid hillside land in China. Journal of Wood Science, 1998, 44(4):296-302.
doi: 10.1007/BF00581310
[6] Khristova P, Kordachia O, Patt R, et al. Alkaline pulping with additives of kenaf from Sudan. Industrial Crops and Products, 2002, 15(3):229-235.
doi: 10.1016/S0926-6690(01)00118-2
[7] 徐建堂, 祁建民, 陶爱芬, 等. 福建省黄红麻遗传育种与综合利用发展研究报告. 海峡科学, 2016(1):128-136.
[8] 国家麻类麻类产业技术体系. 中国现代农业产业可持续发展战略研究麻类分册. 北京: 中国农业出版社, 2017:72-73.
[9] 李祖士. 浙江的麻类作物生产、品种演变和品种资源征集. 中国麻作, 1996, 18(3):13-16.
[10] 祁建民, 方平平, 吴建梅, 等. 我国黄麻红麻科技创新与产业发展的战略思考. 中国麻业科学, 2006, 28(6):277-281.
[11] 陶向新. 模糊数学在农业科学中的初步应用. 沈阳农学院学报, 1982(2):96-107.
[12] 孙铭, 符开欣, 范彦, 等. 15份多花黑麦草优良引进种质的表型变异分析. 植物遗传资源学报, 2016, 17(4):655-662.
[13] 粟建光, 戴志刚, 杨泽茂, 等. 麻类作物特色资源的创新与利用. 植物遗传资源学报, 2019, 20(1):11-19.
[14] 粟建光, 戴志刚, 龚友才, 等. 我国红麻种质资源的遗传多样性与评价利用. 中国麻业, 2004, 26(1):5-9.
[15] 陶爱芬, 祁建民, 李爱青, 等. 红麻优异种质资源遗传多样性与亲缘关系的ISSR分析. 作物学报, 2005, 31(12):1668-1671.
[16] Cheng Z, Lu B R, Sameshima K, et al. Identification and genetic relationships of kenaf (Hibiscus cannabinus L.) germplasm revealed by AFLP analysis. Genetic Resources and Crop Evolution, 2004, 51(4):393-401.
doi: 10.1023/B:GRES.0000023454.96401.1c
[17] 张加强, 金关荣, 骆霞虹, 等. 红麻品种(系)表型性状的因子和聚类分析. 植物遗传资源学报, 2016, 17(6):1000-1007.
[18] 程舟, 鲛岛一彦, 陈家宽. 红麻种质资源遗传变异和亲缘关系的RAPD分析. 中国麻业, 2002, 24(1):1-12.
[19] Xu J, Li A, Wang X, et al. Genetic diversity and phylogenetic relationship of kenaf (Hibiscus cannabinus L.) accessions evaluated by SRAP and ISSR. Biochemical Systematics and Ecology, 2013(49):94-100.
[20] 林荔辉, 汪斌, 陶爱芬, 等. 用ISSR标记分析红麻种质资源的遗传多样性. 武汉植物学研究, 2008, 26(3):240-244.
[21] Pratik S M, Karan C S, Kar A K, et al. Assessment of molecular diversity and evolutionary relationship of kenaf (Hibiscus cannabinus L.), roselle (H. sabdariffa L.) and their wild relatives. Plant Systematics and Evolution, 2013, 299(3):619-629.
doi: 10.1007/s00606-012-0748-8
[22] 兴旺, 崔平, 潘荣, 等. 不同国家甜菜种质资源遗传多样性研究. 植物遗传资源学报, 2018, 19(1):76-86.
[23] 洪建基, 祁建民, 王晓飞, 等. 红麻产量与品质性状的相关及其主成分分析. 福建农林大学学报(自然科学版), 2008, 37(6):561-564.
[1] 段雅娟, 曹士亮, 于滔, 李文跃, 杨耿斌, 王成波, 刘宝民, 刘长华. 玉米自交系萌发期耐盐性鉴定[J]. 作物杂志, 2022, (1): 213–219
[2] 郜战宁, 王树杰, 冯辉, 薛正刚, 杨永乾, 宋晓朋, 介元芬. 二棱大麦品种(系)的综合评价[J]. 作物杂志, 2022, (1): 70–76
[3] 刘歆, 杨芳, 邓军波, 汪嫒嫒, 何念, 陈艳. 江汉平原大豆品系表型分析及综合评价[J]. 作物杂志, 2021, (5): 57–63
[4] 亓晓蕾, 李兴锋, 吕广德, 王瑞霞, 王君, 孙宪印, 孙盈盈, 陈永军, 钱兆国, 吴科. 基于SNP分子标记的泰山/泰科麦系列小麦遗传解析[J]. 作物杂志, 2021, (5): 64–71
[5] 唐红琴, 李忠义, 董文斌, 韦彩会, 何铁光, 蒙炎成, 汤海玲, 莫永诚. 不同间作绿肥替代化肥模式对木薯性状和产量的影响[J]. 作物杂志, 2021, (4): 184–190
[6] 张全芳, 姜明松, 陈峰, 朱文银, 周学标, 杨连群, 徐建第. 山东省水稻品种(系)的遗传多样性分析[J]. 作物杂志, 2021, (4): 26–31
[7] 杜晓宇, 李楠楠, 邹少奎, 王丽娜, 吕永军, 张倩, 李顺成, 杨光宇, 韩玉林. 黄淮南片新育成小麦品种(系)主要性状的综合性分析[J]. 作物杂志, 2021, (4): 38–45
[8] 李琼, 常世豪, 武婷婷, 耿臻, 杨青春, 舒文涛, 李金花, 张东辉, 张保亮. 120份大豆种质资源遗传多样性和亲缘关系分析[J]. 作物杂志, 2021, (4): 51–58
[9] 贾瑞玲, 赵小琴, 南铭, 陈富, 刘彦明, 魏立平, 刘军秀, 马宁. 64份苦荞种质资源农艺性状遗传多样性分析与综合评价[J]. 作物杂志, 2021, (3): 19–27
[10] 周月霞, 范昱, 阮景军, 严俊, 赖弟利, 彭艳, 唐勇, 翁文凤, 程剑平. 燕麦籽粒营养与农艺性状相关性分析[J]. 作物杂志, 2021, (2): 165–172
[11] 白苇, 胡杨, 杨素梅, 张宝英, 崔金丽, 靳涛, 白海花. 冀西北食葵地方资源农艺性状分析[J]. 作物杂志, 2021, (1): 54–59
[12] 杨婉君, 潘香逾, 王秀华, 王璐, 赵岩. 119个苜蓿品种(系)产量和农艺性状的遗传多样性分析[J]. 作物杂志, 2020, (6): 17–22
[13] 高杰, 封广才, 李晓荣, 李青风, 彭秋. 贵州不同地区高粱种质资源表型多样性与聚类分析[J]. 作物杂志, 2020, (6): 54–60
[14] 杨学乐, 张璐, 李志清, 何录秋. 苦荞种质资源表型性状的遗传多样性分析[J]. 作物杂志, 2020, (5): 53–58
[15] 宫彦龙, 雷月, 闫志强, 刘雪薇, 张大双, 吴健强, 朱速松. 不同生态区粳稻资源表型遗传多样性综合评价[J]. 作物杂志, 2020, (5): 71–79
Viewed
Full text


Abstract

Cited

  Shared   
  Discussed   
No Suggested Reading articles found!