Crops ›› 2023, Vol. 39 ›› Issue (2): 36-45.doi: 10.16035/j.issn.1001-7283.2023.02.006
Previous Articles Next Articles
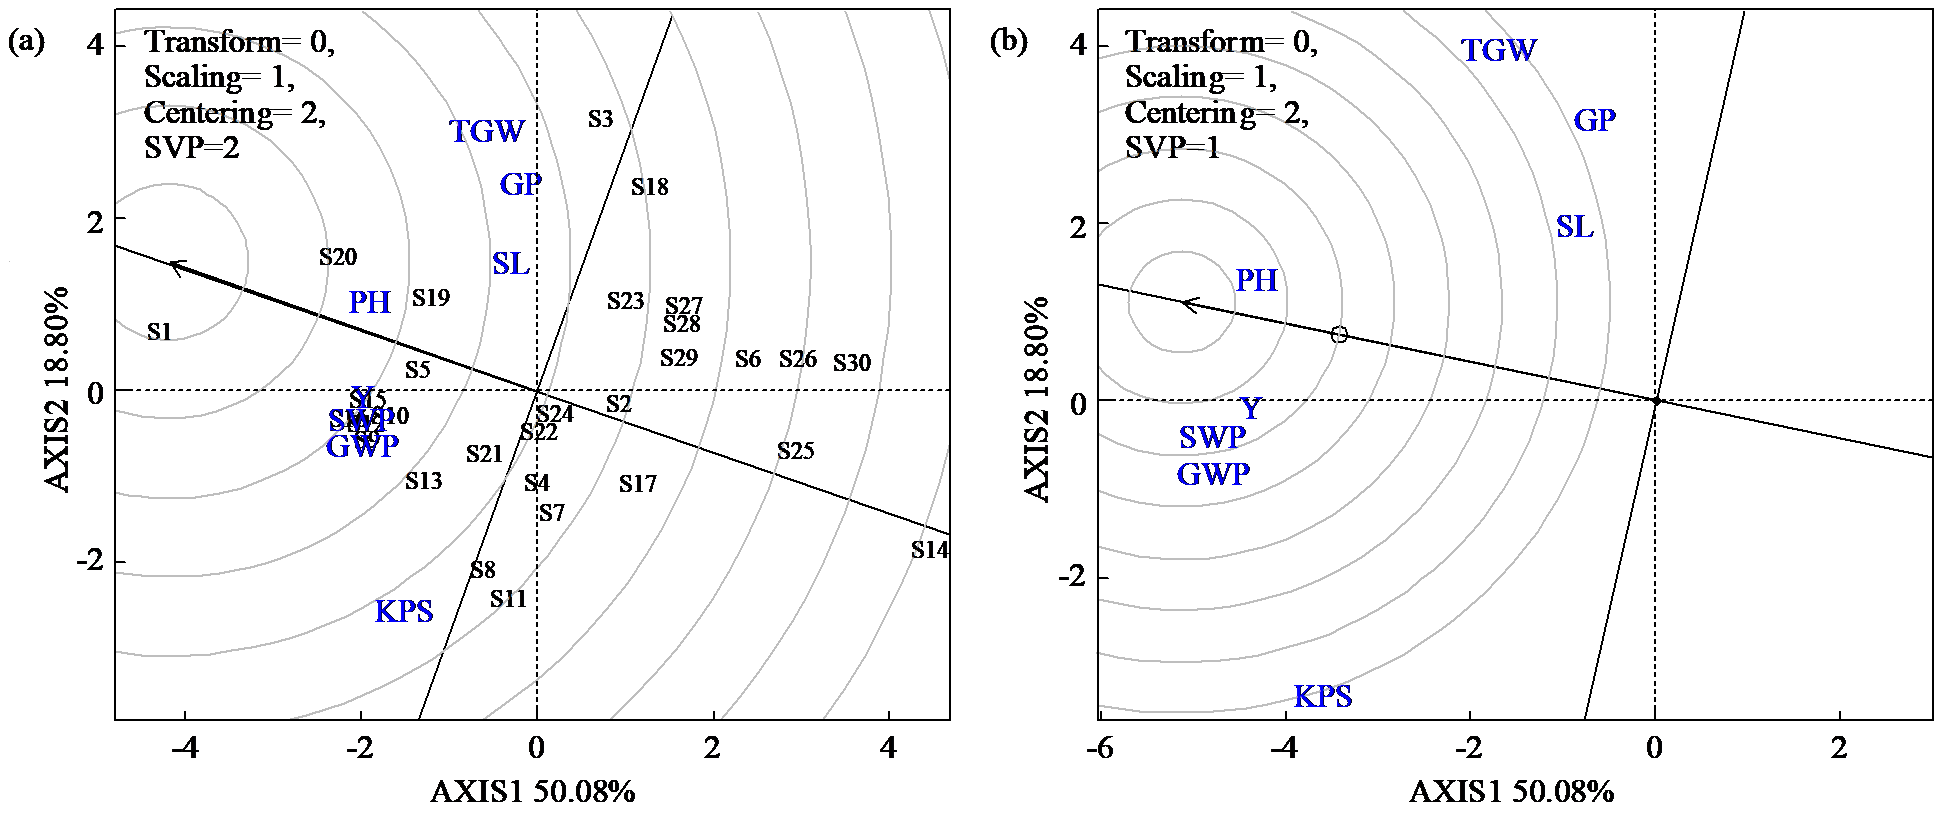
Analysis of Agronomic Traits and Yield Stability of Sorghum Varieties Based on GGE Biplot
Xiao Jibing( ), Liu Zhi(), Kong Fanxin, Xin Zongxu, Wu Hongsheng
- Liaoning Institute of Agriculture & Forestry in Arid Areas, Chaoyang 122000, Liaoning, China

| [1] | 卢庆善. 高粱学. 北京: 中国农业出版社,1999. |
| [2] | Yan W. GGE Biplot vs. AMMI graphs for genotype-by- environment data analysis. Journal of the Indian Society of Agricultural Statistics, 2011, 65(2):1-10. |
| [3] | 常磊, 柴守玺. GGE双标图在我国旱地春小麦稳产性分析中的应用. 中国生态农业学报, 2010, 18(5):988-994. |
| [4] | 许乃银, 张国伟, 李健, 等. 基于GGE双标图的棉花品种生态区划分. 应用生态学报, 2013, 24(3):771-776. |
| [5] | 严威凯, 盛庆来, 胡跃高, 等. GGE叠图法―分析品种×环境互作模式的理想方法. 作物学报, 2001, 27(1):21-28. |
| [6] |
Yang R C, Blade S, Crossa J. Identifying isoyield environments for field pea production. Crop Science, 2005, 45(1):106-113.
doi: 10.1002/csc2.v45.1 |
| [7] | Crossa J. Statistical analyses of multilocation trials. Advances in Gronomy, 1990, 44(1):55-85. |
| [8] |
Yang R C, Crossa J, Cornelius P L, et al. Biplot analysis of genotype×environment interaction:proceed with caution. Crop Science, 2009, 49(5):1564-1576.
doi: 10.2135/cropsci2008.11.0665 |
| [9] | 石强, 李亚杰, 范士杰, 等. 贵州省马铃薯区试品种产量与农艺性状的GGE双标图分析. 干旱地区农业研究, 2015, 33(2):5-15. |
| [10] | 李吉睿, 孟亚雄, 司二静, 等. 中国西北水地春小麦基因型与环境互作及其产量稳定性分析. 甘肃农业大学学报, 2016, 51(6):44-52. |
| [11] |
Yan W, Pageau D, Frégeau-Reid J, et al. Oat mega-environments and test-locations in Quebec. Canadian Journal of Plant Science, 2011, 91(4):643-649.
doi: 10.4141/cjps10139 |
| [12] | 常磊, 韩凡香, 柴守玺, 等. 我国旱地小麦区域试验精确度及其环境综合评价. 应用生态学报, 2013, 24(10):2814-2820. |
| [13] |
Freeman G H, Perkins J M. Environmental and genotype- environmental components of variability Ⅷ-Relations between genotypes grown in different environments and measures of these environments. Heredity, 1971, 27:15-23.
doi: 10.1038/hdy.1971.67 |
| [14] | Yan W K, Kang M S. GGE biplot analysis:A Graphical Tool for Breeders,Geneticists,and Agronomists. Boca Raton, Florida: CRC Press, 2003. |
| [15] |
Yan W, Hunt L A. Cultivar evaluation and mega-environment investigation based on GGE biplot. Crop Science, 2000, 40(3):597-605.
doi: 10.2135/cropsci2000.403597x |
| [16] |
Yan W, Holland J B. A heritability-adjusted GGE biplot for test environment evaluation. Euphytica, 2010, 171(3):355-369.
doi: 10.1007/s10681-009-0030-5 |
| [17] |
Dehghani H, Ebadi A, Yousefi A. Biplot analysis of genotype by environment interaction for barley yield in Iran. Agronomy Journal, 2006, 98:388-393.
doi: 10.2134/agronj2004.0310 |
| [18] | 昝凯, 陈亚光, 徐淑霞, 等. 基于R语言的GGE双标图在大豆区试中的应用. 大豆科技, 2019(4):16-20. |
| [19] | 陈四龙, 李玉荣, 程增书, 等. 用GGE双标图分析种植密度对高油花生生长和产量的影响. 作物学报, 2009, 35(7):1328-1335. |
| [20] |
Yan W. GGE biplot—A Windows application for graphical analysis of multi environment trial data and other types of two‐ way data. Agronomy Journal, 2001, 93(5):1111-1118.
doi: 10.2134/agronj2001.9351111x |
| [21] | 李亚杰, 罗磊, 白江平, 等. GGE双标图在西北旱区马铃薯新品种选育中的应用. 干旱地区农业研究, 2018, 36(2):192-198. |
| [22] |
严威凯. 双标图分析在农作物品种多点试验中的应用. 作物学报, 2010, 36(11):1805-1819.
doi: 10.3724/SP.J.1006.2010.01805 |
| [23] |
Luo L, Zhang F, Hong M, et al. Evaluation of yield,stability and adaptability of national winter rapeseed regional trials in the upper Yangtze River region in 2017-2018. Oil Crop Science, 2020, 5(3):121-128.
doi: 10.1016/j.ocsci.2020.07.001 |
| [24] |
Flores F, Hybl M, Knudsen J C, et al. Adaptation of spring faba bean types across European climates. Field Crops Research, 2013, 145:1-9.
doi: 10.1016/j.fcr.2013.01.022 |
| [25] |
Yan W. LG biplot:a graphical method for mega-environment investigation using existing crop variety trial data. Scientific Reports, 2019, 9(1):1-8.
doi: 10.1038/s41598-018-37186-2 |
| [26] | Choudhary M, Kumar B, Kumar P, et al. GGE biplot analysis of genotype × environment interaction and identification of mega- environment for baby corn hybrids evaluation in India. Indian Journal of Genetics and Plant Breeding, 2019, 79(4):658-669. |
| [27] |
de Oliveira T R A, de Carvalho H W L, Oliveira G H F, et al. Hybrid maize selection through GGE biplot analysis. Bragantia, 2019, 78(2):166-174.
doi: 10.1590/1678-4499.20170438 |
| [28] |
Yan W, Pageau D, Frégeau-reid J, et al. Assessing the representativeness and repeatability of test locations for genotype evaluation. Crop Science, 2011, 51(4):1603-1610.
doi: 10.2135/cropsci2011.01.0016 |
| [29] |
Badu-apraku B, Akinwale R O. Biplot analysis of line× tester data of maize (Zea mays L.) inbred lines under stress and nonstress environments. Cereal Research Communications, 2019, 47(3):518-530.
doi: 10.1556/0806.47.2019.25 |
| [30] |
Xi K, Turkington T K, Juskiw P, et al. Field screening is effective for identifying genetic resistance to scald of barley. Crop Science, 2019, 59(4):1479-1493.
doi: 10.2135/cropsci2018.09.0536 |
| [31] |
Shojaei S H, Mostafavi K, Khosroshahli M, et al. Assessment of genotype-trait interaction in maize (Zea mays L.) hybrids using GGT biplot analysis. Food Science Nutrition, 2020, 8(10):5340-5351.
doi: 10.1002/fsn3.v8.10 |
| [32] | Shiri M, Kamrani M, Ebadi A. Evaluation of integrated nitrogen and phosphorous management using the TT biplot method in soybean. Journal of Agricultural Sciences, 2020, 65(1):19-35. |
| [33] |
Baduapraku B, Akinwale R O. Cultivar evaluation and trait analysis of tropical early maturing maize under Striga-infested and Striga-free environments. Field Crops Research, 2011, 121(1):186-194.
doi: 10.1016/j.fcr.2010.12.011 |
| [34] | 周宇飞, 依兵, 吴奇, 等. 基于GGE双标图的高粱品种产量及其稳定性分析. 沈阳农业大学学报, 2018, 49(6):649-654. |
| [35] | 彭远英, 颜红海, 郭来春, 等. 燕麦属不同倍性种质资源抗旱性状评价及筛选. 生态学报, 2011, 31(9):2478-2491. |
| [36] | 陆平. 高粱种质资源描述规范和数据标准. 北京: 中国农业出版社, 2006. |
| [37] |
Yan W, Hunt L A, Sheng Q, et al. Cultivar evaluation and mega- environment investigation based on the GGE biplot. Crop Science, 2000, 40(3):597-605.
doi: 10.2135/cropsci2000.403597x |
| [38] |
Belay F, Meresa H, Gebreslasie A. Evaluation of the performance of some white seeded sesame (Sesamum Indicum L.) genotypes using GGE biplot analysis in Northern Ethiopia. Journal of Cereals and Oilseeds, 2018, 9(1):1-9.
doi: 10.5897/JCO |
| [39] | 赵祖亮, 曲艺伟, 刘哲, 等. 玉米产量的品种与环境互作效应空间分布规律. 农业工程学报, 2015, 31(24):232-238. |
| [40] |
陈彩锦, 张尚沛, 师尚礼, 等. 基于GGE双标图对苜蓿品种丰产性和稳定性综合评价. 草地学报, 2021, 29(5):912-918.
doi: 10.11733/j.issn.1007-0435.2021.05.007 |
| [41] | 柳娜, 曹东, 王世红, 等. 基于GGE双标图的甘肃春小麦区试品系稳产性和试点代表性分析. 西北农林科技大学学报(自然科学版), 2018, 46(4):39-48. |
| [42] | Kabak D, Akçura M. Bingöl ilinden toplanan yerel çavdarlarda tane verimi ve bazı özellikler arasındaki ilişkilerin biplot analizi ile incelenmesi. Türk Tarım ve Doğa Bilimleri Dergisi, 2017, 4(2):227-235. |
| [43] | Sabaghnia N. Investigation of some morphological traits in studied lentil (Lens culinaris Medik.) genotypes grown with foliar application of nanosized ferric oxide//Annales Universitatis Mariae Curie-Sklodowska,sectio C-Biologia. Wydawnictwo Uniwersytetu Marii Curie-Skłodowskiej, 2014, 69(2):29-38. |
| [44] |
肖继兵, 刘志, 孔凡信, 等. 种植方式和密度对高粱群体结构和产量的影响. 中国农业科学, 2018, 51(22):4264-4276.
doi: 10.3864/j.issn.0578-1752.2018.22.005 |
| [1] | Yang Shiqi, Chen Liming, Zhou Yanzhi, Tan Xueming, Zeng Yongjun, Shi Qinghua, Pan Xiaohua, Zeng Yanhua. Effects of Weeds Control on the Yield and Quality of Double- Cropping Direct-Seeded High-Quality Late Indica Rice [J]. Crops, 2023, 39(2): 121-125. |
| [2] | Liu Yu, Cao Jialin, Xiao Zhengwu, Zhang Mingyu, Chen Jia’na, Cao Fangbo, Huang Min. Effects of Nitrogen Application Rates on Yield and Nitrogen Use Efficiency of Super Hybrid Rice Y-liangyou 900 [J]. Crops, 2023, 39(2): 126-130. |
| [3] | Ma Ruiqi, Wang Demei, Tao Zhiqiang, Wang Yanjie, Yang Yushuang, Zhao Guangcai, Chang Xuhong. Effects of Topdressing Nitrogen Amount on Yield and Agronomic Traits of Different Gluten Type Wheat Cultivars [J]. Crops, 2023, 39(2): 131-137. |
| [4] | Cui Shuna, Wang Ye, Lu Yuqing, Pan Jinbao, Zhang Qiuzhi. Correlation and Path Analysis of Three Ear Leaves on Yield in Maize [J]. Crops, 2023, 39(2): 201-206. |
| [5] | Xu Dong, He Jianqing, Zhang Gejie, Liu Haixin, Ma Jinyu, Wang Siyuan. Effects of Fertilizer Combined with Garden Waste Compost on Yield, Quality of Highland Barley and Soil Fertility [J]. Crops, 2023, 39(2): 214-221. |
| [6] | Ma Jiyu, Wang Shuang, Li Yun, Guo Zhenqing, Wang Jian, Lin Xiaohu, Han Yucui. Effects of Planting Density on Agronomic Characteristics and Yield of Foxtail Millet [J]. Crops, 2023, 39(2): 222-228. |
| [7] | Gu Yibiao, Yan Jiaqian, Xue Zhangyi, Shu Chenchen, Zhang Weiyang, Zhang Hao, Liu Lijun, Wang Zhiqin, Zhou Zhenling, Xu Dayong, Yang Jianchang, Gu Junfei. Different Responses of Roots of Rice Varieties to Salt Stress and the Underlying Mechanisms [J]. Crops, 2023, 39(2): 67-76. |
| [8] | Tang Zhongjie, Xie Deyi, Xu Shouming, Nie Lihong, Lü Shuping, Wang Mingkun. Changes of Insect Resistance and Its Correlation Analysis with Yield Traits in Transgenic Bt Cotton from 2005 to 2020 [J]. Crops, 2023, 39(2): 77-82. |
| [9] | Yuan Shuai, Su Yuting, Chen Pingping, Yi Zhenxie. Effects of Nitrogen Management on Yield Formation and Rice Quality of Double Cropping Hybrid Rice in Southern Hunan [J]. Crops, 2023, 39(2): 91-99. |
| [10] | Xia Yuying, Wang Zhijun, Li Hongyu, Hu Chuanjun, Lü Yandong, Zhao Haicheng, Zheng Guiping. Effects of Seedling Raising Methods on Seedling Quality, Yield and Quality of Rice in Cold Region [J]. Crops, 2023, 39(1): 103-108. |
| [11] | Gao Wei, Hao Qingting, Zhang Zeyan, Wang Qian, Yan Hubin, Zhu Huijun, Zhao Xueying, Zhang Yaowen. Effects of Nitrogen and Phosphorus Application on Yield, Root Morphology and Photosynthetic Characteristics of Adzuki Bean [J]. Crops, 2023, 39(1): 109-114. |
| [12] | Wang Yujiao, Chang Xuhong, Wang Demei, Wang Yanjie, Yang Yushuang, Shi Shubing, Zhao Guangcai. Effects of Sowing Methods on Yield and Quality of Different Varieties of Wheat [J]. Crops, 2023, 39(1): 122-128. |
| [13] | Zhao Jingyun, Lü Xinyun, Liu Xiaorong, Ren Haihong, Ren Xiaojun, Ma Junkui. Effects of Strip Compound Intercropping under Young Walnut Forest on Soybean Growth and Yield [J]. Crops, 2023, 39(1): 136-142. |
| [14] | Zhai Caijiao, Zhang Jiao, Cui Shiyou, Chen Pengjun, Han Jijun. Effects of Slow/Controlled Release Fertilizer Application on Growth, Yield and Quality of Rice under Salt Stress [J]. Crops, 2023, 39(1): 143-151. |
| [15] | Li Wenshan, Zhang Junyao, Tang Jianghua, Xu Wenxiu, Xu Qinghua. Effects of Different Doses of AFD on Growth and Yield of Cotton [J]. Crops, 2023, 39(1): 158-162. |
|
||