作物杂志,2023, 第5期: 264–271 doi: 10.16035/j.issn.1001-7283.2023.05.037

• 生理生化·植物营养·栽培耕作 • 上一篇    下一篇

基于LMDI模型的甘肃省种植业生产碳排放影响因素分析及减排途径

李薇1(), 蒙平珠2, 李彩弟2, 燕振刚2()   

  1. 1甘肃农业大学财经学院,730070,甘肃兰州
    2甘肃农业大学信息科学技术学院,730070,甘肃兰州
  • 收稿日期:2022-05-11 修回日期:2022-09-04 出版日期:2023-10-15 发布日期:2023-10-16
  • 通讯作者: 燕振刚,研究方向为信息技术在农业中的应用,E-mail:yanzhg@gsau.edu.cn
  • 作者简介:李薇,研究方向为农业经济管理,E-mail:2273885149@qq.com
  • 基金资助:
    甘肃省科技计划项目软科学专项(23JRZA450);甘肃省高校教师创新基金项目(2023B-081);甘肃省重点研发计划(21YF5FA095)

Analysis of Influencing Factors of Carbon Emissions from Planting Production Based on LMDI Model and Approaches of Carbon Mitigation in Gansu Province

Li Wei1(), Meng Pingzhu2, Li Caidi2, Yan Zhengang2()   

  1. 1College of Finance and Economics, Gansu Agricultural University, Lanzhou 730070, Gansu, China
    2College of Information Science and Technology, Gansu Agricultural University, Lanzhou 730070, Gansu, China
  • Received:2022-05-11 Revised:2022-09-04 Online:2023-10-15 Published:2023-10-16

摘要:

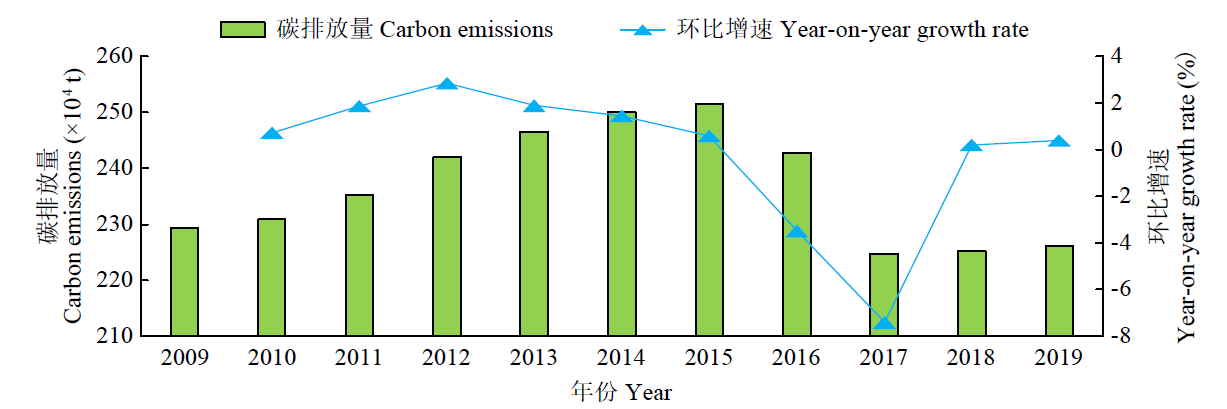
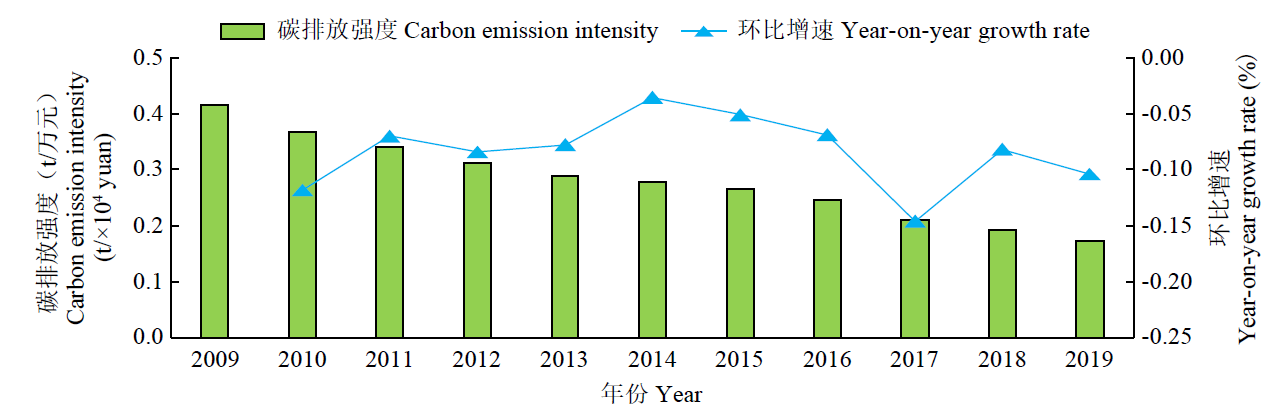
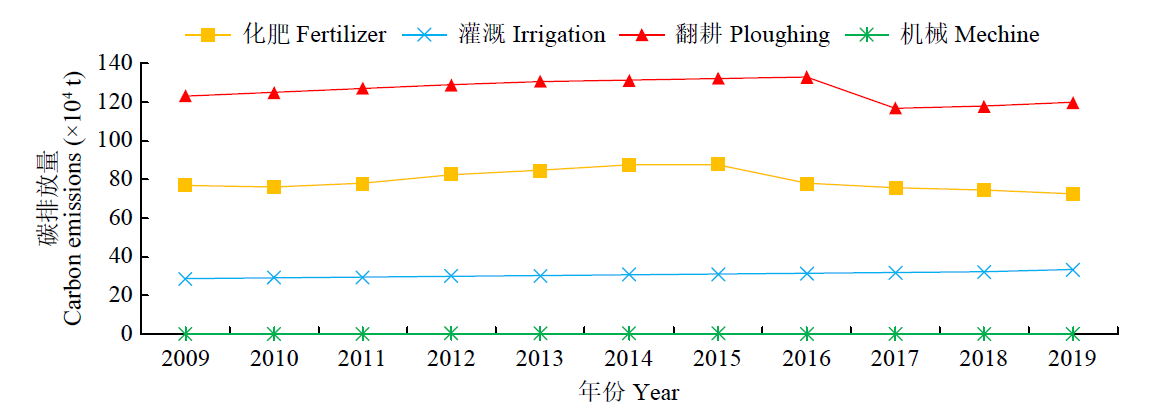
种植业生产过程所产生的碳排放在农业生产活动碳排放总量中占有很大比例。因此,评估种植业碳排放量并分析其影响因素,对实现区域农业生产固碳减排有重要意义。针对甘肃种植业生产碳排放测算和影响因素进行分析,运用LMDI模型构建了碳排放指标体系,估算了甘肃省5个典型生态区域近10年的种植业生产碳排放量。结果表明,2009-2019年甘肃省种植业生产碳排放总量呈先上升后下降的趋势,而碳排放强度呈逐渐下降的趋势。河西地区的种植业生产碳排放量(0.79t C/hm2)最高,碳排放强度较低(0.20t C/万元),民族地区碳排放量(0.45t C/hm2)最低,碳排放强度(0.31t C/万元)最高。碳排放主要源于翻耕、化肥、灌溉和农用机械。农业结构、人口和经济因素对碳排放产生促进作用,其中经济因素的作用最为明显。碳排放强度和产业结构因素对种植业生产的碳排放量增加有减缓作用,其中碳排放强度的作用最为明显。由此,为了甘肃种植业的碳减排,提倡保护性轮作休耕、免耕或者少耕,有机无机肥配施,推行节水灌溉,采用新能源农用机械等农艺措施;传统农业向现代农业转变是种植业生产碳减排的主要途径。

关键词: LMDI因素分解模型, 种植业生产, 碳排放, 影响因素, 碳减排途径

Abstract:

Carbon emission from planting production played large porportion of total amount of carbon emission from agricultural production. Therefore, estimating carbon emissions from planting produciton, analyzing the influencing factors, achieving the carbon sequestration and emission mitigation in regional agricultural production had important significance. Carbon emission evaluation and influencing factors were analyzed for planting production in Gansu, this study was to construct the index system of carbon emission from planting production using LMDI model, and evaluated the carbon emission from the five typical ecological zones in recent ten years. The results showed that carbon emissions from planting production during 2009 to 2019 generally increased first and then declined, but the carbon emission intensity decreased gradually. Hexi region had the highest carbon emissions (0.79t C/ha) from planting production and a lower carbon emission intensity (0.20t C/×104 yuan). The nationality region had the lowest carbon emissions (0.45t C/ha) and the highest carbon emission intensity (0.31t C/×104yuan). Tillage, fertilizer, irrigation and machinery were the dominant sources of carbon emission. Agricultural structure, population and economic factors had effectively effects on carbon emissions, and impact of economy factor was more obvious. Carbon emission intensity and industrial structure had inhibiting effects on carbon emissions, and the impact of carbon emission intensity was more obvious. Thus, to mitigate carbon emissions from planting production in Gansu, the main approaches should be application of agronomic measures of protective crop rotation, no-tillage or less tillage, combined application of organic and inorganic fertilizer, water saving irrigation, use of new energy agricultural machinery. The transformation of traditional agriculture to modern agriculture is the main way to reduce carbon emissions in planting production.

Key words: LMDI factor decomposition model, Planting production, Carbon emissions, Influencing factors, Approaches of carbon mitigation

表1

种植业生产碳排放系数

符号
Symbol
碳排放源
Carbon emission source
碳排放系数
Carbon emission coefficient
文献
Reference
A 化肥生产和使用过程产生的碳排放 0.8956kg C/t [11]
B 地膜生产和使用过程产生的碳排放 5.18kg C/kg [12]
C 农业灌溉过程中用电产生的碳排放 266.48kg C/hm2 [12]
D 农业翻耕造成土壤CO2碳排放 312.6kg C/hm2 [13]
E 农业机械使用过程消耗化石燃料(柴油、电力等)产生的碳排放 0.18kg C/kW [14]

图1

2009-2019年甘肃省种植业生产碳排放总量及其增速变化

表2

甘肃省区域种植业生产碳排放量

地区
Region
市/自治州
Municipality/
autonomous prefecture
2009 2010 2011 2012 2013 2014 2015 2016 2017 2018 2019 年平均值
Annual
average
地区平均值
Region
average
河西地区
Hexi oasis
武威 0.48 0.61 0.59 0.57 0.56 0.57 0.56 0.45 0.52 0.53 0.48 0.54±0.05 0.79±0.14
金昌 0.57 0.80 0.79 0.81 0.86 0.80 0.78 0.72 0.70 0.70 0.73 0.75±0.08
张掖 0.59 0.78 0.83 0.88 0.91 0.93 0.92 0.87 0.86 0.83 0.92 0.85±0.09
嘉峪关 0.69 1.01 1.08 1.11 1.09 1.15 1.11 0.87 0.48 0.48 0.49 0.87±0.03
酒泉 0.71 0.96 0.97 0.99 0.99 1.01 0.98 0.90 0.88 0.90 0.89 0.93±0.08
陇东黄土高原
Loess plateau of east Gansu
平凉 0.90 0.94 0.92 0.90 0.91 0.89 0.88 0.87 0.73 0.72 0.68 0.85±0.09 0.66±0.19
庆阳 0.44 0.47 0.46 0.47 0.47 0.47 0.47 0.47 0.53 0.50 0.50 0.48±0.02
陇中黄土高原
Loess plateau of
central Gansu
兰州 0.48 0.59 0.59 0.59 0.60 0.59 0.58 0.54 0.64 0.63 0.61 0.59±0.04 0.54±0.04
白银 0.46 0.55 0.54 0.54 0.55 0.56 0.56 0.56 0.53 0.53 0.53 0.54±0.03
定西 0.43 0.46 0.45 0.48 0.49 0.49 0.50 0.50 0.52 0.51 0.51 0.48±0.03
秦巴山区
Qianba mountain
天水 0.45 0.47 0.48 0.48 0.47 0.48 0.48 0.50 0.61 0.59 0.62 0.51±0.06 0.51±0.06
陇南 0.45 0.49 0.50 0.50 0.50 0.50 0.50 0.49 0.55 0.53 0.52 0.50±0.02
民族地区
Nationality region
临夏 0.44 0.54 0.52 0.53 0.52 0.52 0.52 0.51 0.54 0.55 0.53 0.52±0.03 0.45±0.07
甘南 0.35 0.38 0.38 0.38 0.38 0.38 0.38 0.38 0.39 0.38 0.37 0.38±0.01

图2

2009-2019年甘肃省种植业生产碳排放强度及其增速

表3

Carbon emission intensity of regional planting production in Gansu province t/万元 t/×104yuan

地区
Region
市/自治州Municipality/
autonomous prefecture
2009 2010 2011 2012 2013 2014 2015 2016 2017 2018 2019 年平均值
Annual
average
地区平均值
Region
average
河西地区
Hexi oasis
武威 0.33 0.38 0.35 0.19 0.25 0.24 0.21 0.16 0.20 0.18 0.14 0.24±0.08 0.20±0.06
金昌 0.28 0.35 0.33 0.25 0.27 0.23 0.23 0.19 0.24 0.21 0.16 0.25±0.05
张掖 0.24 0.28 0.27 0.15 0.22 0.23 0.22 0.19 0.30 0.24 0.18 0.23±0.04
嘉峪关 0.09 0.11 0.10 0.07 0.09 0.09 0.09 0.07 0.07 0.07 0.06 0.08±0.02
酒泉 0.23 0.27 0.25 0.13 0.20 0.19 0.17 0.14 0.22 0.19 0.14 0.19±0.07
陇东黄土高原
Loess plateau of east Gansu
平凉 0.40 0.35 0.33 0.21 0.26 0.23 0.20 0.19 0.23 0.17 0.17 0.25±0.07 0.28±0.04
庆阳 0.46 0.40 0.37 0.24 0.28 0.28 0.27 0.27 0.37 0.31 0.25 0.32±0.07
陇中黄土高原
Loess plateau of
central Gansu
兰州 0.26 0.28 0.25 0.18 0.22 0.20 0.18 0.16 0.23 0.19 0.15 0.21±0.04 0.27±0.05
白银 0.36 0.39 0.38 0.21 0.30 0.28 0.27 0.26 0.27 0.24 0.19 0.29±0.06
定西 0.46 0.43 0.40 0.25 0.29 0.29 0.28 0.28 0.32 0.28 0.24 0.32±0.07
秦巴山区
Qianba mountain
天水 0.31 0.26 0.24 0.17 0.19 0.17 0.16 0.16 0.17 0.17 0.13 0.19±0.05 0.24±0.05
陇南 0.49 0.45 0.35 0.31 0.29 0.26 0.25 0.24 0.22 0.20 0.17 0.29±0.10
民族地区
Nationality region
临夏 0.34 0.34 0.30 0.26 0.24 0.23 0.22 0.21 0.24 0.24 0.21 0.26±0.05 0.31±0.05
甘南 0.41 0.41 0.48 0.40 0.37 0.34 0.33 0.30 0.37 0.28 0.23 0.36±0.07

图3

2009-2019年甘肃省种植业生产各环节碳排放量变化

表4

2009-2019年甘肃省区域种植业生产各环节碳排放总量及其占比

地区
Region
市/自治州Municipality/
autonomous
prefecture
化肥
Fertilizer
灌溉
Irrigation
翻耕
Tillage
农用机械
Farm machinery
总量
Total(×104t)
比重
Proportion (%)
总量
Total(×104t)
比重
Proportion (%)
总量
Total(×104t)
比重
Proportion (%)
总量
Total(×104t)
比重
Proportion (%)
河西地区
Hexi oasis
武威 128.73 15.30 49.97 16.97 85.89 6.29 0.62 14.95
金昌 19.90 2.37 16.66 5.66 26.29 1.93 0.19 4.52
张掖 89.43 10.63 49.78 16.90 93.17 6.83 0.43 10.31
嘉峪关 1.80 0.21 0.81 0.27 1.69 0.12 0.02 0.53
酒泉 73.97 8.79 44.53 15.12 60.78 4.45 0.44 10.41
陇东黄土高原
Loess plateau of east Gansu
平凉 91.75 10.91 11.37 3.86 147.90 10.83 0.23 5.51
庆阳 95.19 11.31 13.34 4.53 208.94 15.31 0.34 8.04
陇中黄土高原
Loess plateau of
central Gansu
兰州 41.04 4.88 20.70 7.03 71.88 5.27 0.27 6.40
白银 50.47 6.00 26.92 9.14 108.71 7.96 0.39 9.25
定西 84.89 10.09 17.61 5.98 188.67 13.82 0.43 10.28
秦巴山区
Qianba mountain
天水 74.84 8.90 9.60 3.26 154.50 11.32 0.27 6.56
陇南 64.54 7.67 16.92 5.75 136.85 10.02 0.31 7.38
民族地区
Nationality region
临夏 21.42 2.55 14.74 5.00 55.52 4.07 0.17 4.07
甘南 3.36 0.40 1.55 0.53 24.35 1.78 0.07 1.78

表5

甘肃省种植业生产碳排放影响因素贡献值

年份Year ΔCI ΔAI ΔSI ΔEI ΔP ΔC
2009
2010 -28.95 2.57 27.58 42.76 0.46 44.42
2011 -16.82 -3.64 24.38 46.23 0.38 50.54
2012 -20.90 -0.36 26.71 25.71 1.24 32.40
2013 -19.71 -2.00 25.84 26.19 0.44 30.76
2014 -8.92 -1.34 12.99 19.14 0.83 22.70
2015 -12.99 1.28 12.35 0.62 0.85 2.11
2016 -17.59 -12.90 20.73 11.91 0.99 3.14
2017 -36.88 2.25 15.20 12.66 1.41 -5.35
2018 -19.17 2.93 15.72 21.39 0.99 21.86
2019 -24.74 -2.81 27.58 15.62 0.87 16.51
总计Total -206.66 -14.30 209.09 222.23 8.44 219.07
贡献值
Contribution value
0.42 0.95 2.42 2.57 1.04
[1] 李玉强, 陈云, 曹纹婕, 等. 全球变化对资源环境及生态系统影响的生态学理论基础. 应用生态学报, 2022, 33(3):603-612.
doi: 10.13287/j.1001-9332.202203.019
[2] 林斌, 徐孟, 汪笑溪. 农业生产的温室气体排放研究进展. 中国生态农业学报(中英文), 2022, 30(4):500-515.
[3] Yan Z G, Hou F J, Yan T H. Evaluation of greenhouse gas emissions from three contrasting integrated crop and livestock production systems during 1991-2016 in Gansu of China. Pakistan Journal of Agricultural Sciences, 2019, 56(2):469-480.
doi: 10.21162/PAKJAS
[4] 郭险峰, 艾静静. 农业碳排放的时空演变,影响因素及脱钩效应研究——基于31省2000-2019年面板数据. 西昌学院学报(自然科学版), 2022, 36(1):9-15.
[5] 陈炜, 殷田园, 李红兵. 1997-2015年中国种植业碳排放时空特征及与农业发展的关系. 干旱区资源与环境, 2019, 33(2):37-44.
[6] Chen G Q, Zhang B. Greenhouse gas emissions in China 2007: inventory and input-output analysis. Energy Policy, 2010, 38:6180-6193.
doi: 10.1016/j.enpol.2010.06.004
[7] 李政通, 白彩全, 肖薇薇. 基于LMDI模型的东北地区农业碳排放测度与分解. 干旱地区农业研究, 2017, 35(4):145-152.
[8] 文清, 田云, 王雅鹏. 中国农业碳排放省域差异与驱动机理研究——基于30个省(市,区)1993-2012年的面板数据分析. 干旱区资源与环境, 2015, 29(11):1-6.
[9] 罗君, 张学斌. 甘肃省农业经济发展的区域差异研究. 农业现代化研究, 2013, 34(6):713-716.
[10] 燕振刚, 李薇, Yan T H, 等. BP神经网络算法在河西绿洲玉米生产碳排放评估中的应用及算法有效性研究. 中国生态农业学报, 2018, 26(8):1100-1106.
[11] 段华平, 张悦, 赵建波, 等. 中国农田生态系统的碳足迹分析. 水土保持学报, 2011, 25(5):203-208.
[12] 李彩弟, 燕振刚. 基于LMDI的张掖市农业碳排放影响因素分析. 生产力研究, 2020(5):98-101,161.
[13] 何炫蕾, 陈兴鹏, 庞家幸. 基于LMDI的兰州市农业碳排放现状及影响因素分析. 中国农业大学学报, 2018, 23(7):150-158.
[14] 朱巧娴, 梅昀, 陈银蓉, 等. 基于碳排放测算的湖北省土地利用结构效率的DEA模型分析与空间分异研究. 经济地理, 2015, 35(12):176-184.
[15] 严圣吉, 邓艾兴, 尚子吟, 等. 我国作物生产碳排放特征及助力碳中和的减排固碳途径. 作物学报, 2022, 48(4):1-13.
[16] 金书秦, 林煜, 牛坤玉. 以低碳带动农业绿色转型:中国农业碳排放特征及其减排路径. 改革, 2021, 327(5):29-37.
[17] 张琦, 王淑兰, 王浩, 等. 深松与免耕频次对黄土旱塬春玉米田土壤团聚体与土壤碳库的影响. 中国农业科学, 2020, 53(14):2840-2851.
doi: 10.3864/j.issn.0578-1752.2020.14.008
[18] Chai Q, Nemecek T, Liang C, et al. Integrated farming with intercropping increases food production while reducing environmental footprint. Proceedings of the National Academy of Sciences of the United States of America, 2021, 118(38):1-12.
[19] 邓长芳, 罗珠珠, 李玲玲, 等. 黄土高原雨养农业区不同种植模式土壤温室气体排放特征. 草业学报, 2018, 27(9):1-13.
doi: 10.11686/cyxb2017530
[20] 张勃, 郝建秀, 李太安, 等. 关于河西地区生态经济发展的几个问题. 草业科学, 2003, 20(11):36-39.
[21] Jing Q, Bouman B, Hengsdijk H, et al. Exploring options to combine high yields with high nitrogen use efficiencies in irrigated rice in China. European Journal of Agronomy, 2007, 26 (2):166-177.
doi: 10.1016/j.eja.2006.09.005
[22] 赵佐平. 秦巴山区主要农作物肥料投入现状评估分析. 中国农业大学学报, 2015, 20(4):127-133.
[1] 李浩然, 李瑞奇, 李雁鸣. 海河平原小麦行距形式变化及其影响因素研究综述[J]. 作物杂志, 2023, (3): 12–19
[2] 严圣吉, 尚子吟, 邓艾兴, 张卫建. 我国农田氧化亚氮排放的时空特征及减排途径[J]. 作物杂志, 2022, (3): 1–8
[3] 刘颖慧,郭明,贾树利,尹建国. 影响青贮玉米品质因素研究进展[J]. 作物杂志, 2018, (2): 6–10
[4] 吴建富,卢志红,胡丹丹. 科学认识有机肥料在农业生产中的作用[J]. 作物杂志, 2017, (5): 1–6
[5] 李少昆,王克如,谢瑞芝,李璐璐,明博,侯鹏,初振东,张万旭,刘朝巍. 玉米子粒机械收获破碎率研究[J]. 作物杂志, 2017, (2): 76–80
[6] 谢阳姣,何志鹏,李耀燕,闫国跃,符标芳. 苦玄参药材中苦玄参苷IA和IB差异积累的影响因素分析[J]. 作物杂志, 2016, (3): 89–93
[7] 赵苗苗, 张文忠, 裴瑶, 等. 农田温室气体N2O排放研究进展[J]. 作物杂志, 2013, (4): 25–31
[8] 严雯奕, 叶胜海, 董彦君, 等. 植物叶片衰老相关研究进展[J]. 作物杂志, 2010, (4): 4–9
[9] 华国栋, 李冠喜, 浦汉春, 等. 小麦种子活力的影响因素与控制及种子贮藏技术[J]. 作物杂志, 2009, (6): 89–91
[10] 王芳. 无土基质栽培生产脱毒马铃薯微型薯的关键技术[J]. 作物杂志, 2008, (5): 97–100
[11] 马盾, 刘健. 新疆大豆褐斑、硬实的产生及其影响因素[J]. 作物杂志, 1995, (1): 37–38
Viewed
Full text


Abstract

Cited

  Shared   
  Discussed   
No Suggested Reading articles found!