
作物杂志,2025, 第4期: 150–156 doi: 10.16035/j.issn.1001-7283.2025.04.019
长江三角洲地区主要类型水稻生产资源投入及碳、氮足迹评估
杨林生1( ), 习敏1(), 涂德宝1, 李忠1, 周永进1, 许有尊1, 孙雪原1, 吴文革2
- 1安徽省农业科学院水稻研究所,230031,安徽合肥
2安徽农业大学资源与环境学院,230031,安徽合肥
Assessment of Resource Input and Carbon, Nitrogen Footprint for Major Types of Rice in Yangtze River Delta Region
Yang Linsheng1(), Xi Min1(), Tu Debao1, Li Zhong1, Zhou Yongjin1, Xu Youzun1, Sun Xueyuan1, Wu Wenge2
- 1Rice Research Institute, Anhui Academy of Agricultural Sciences, Hefei 230031, Anhui, China
2College of Resources and Environment, Anhui Agricultural University, Hefei 230031, Anhui, China
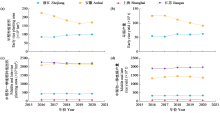
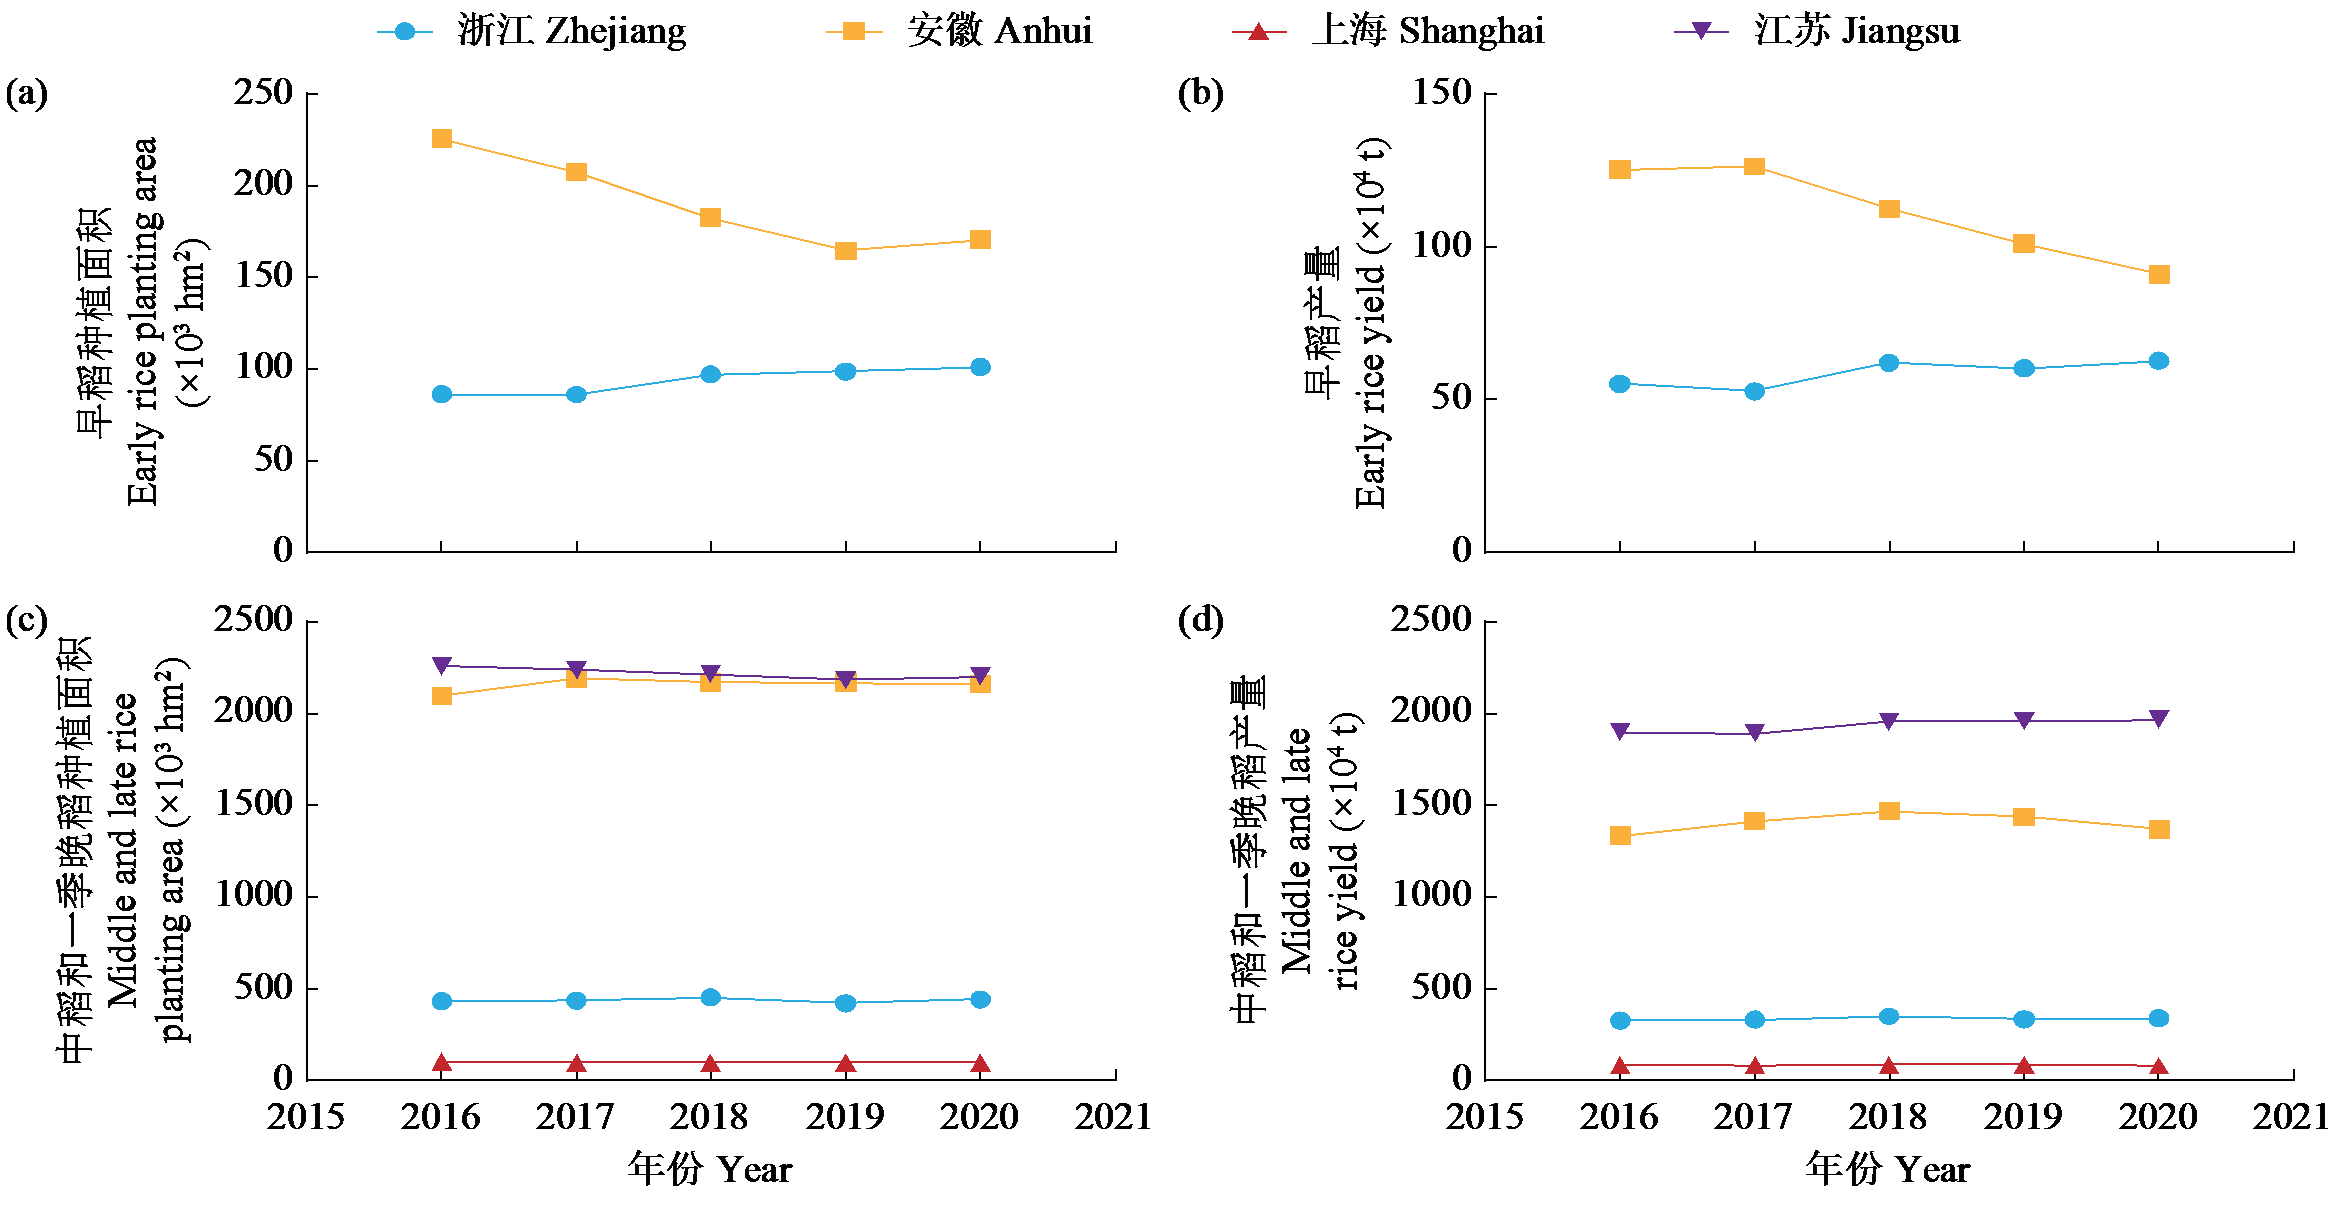
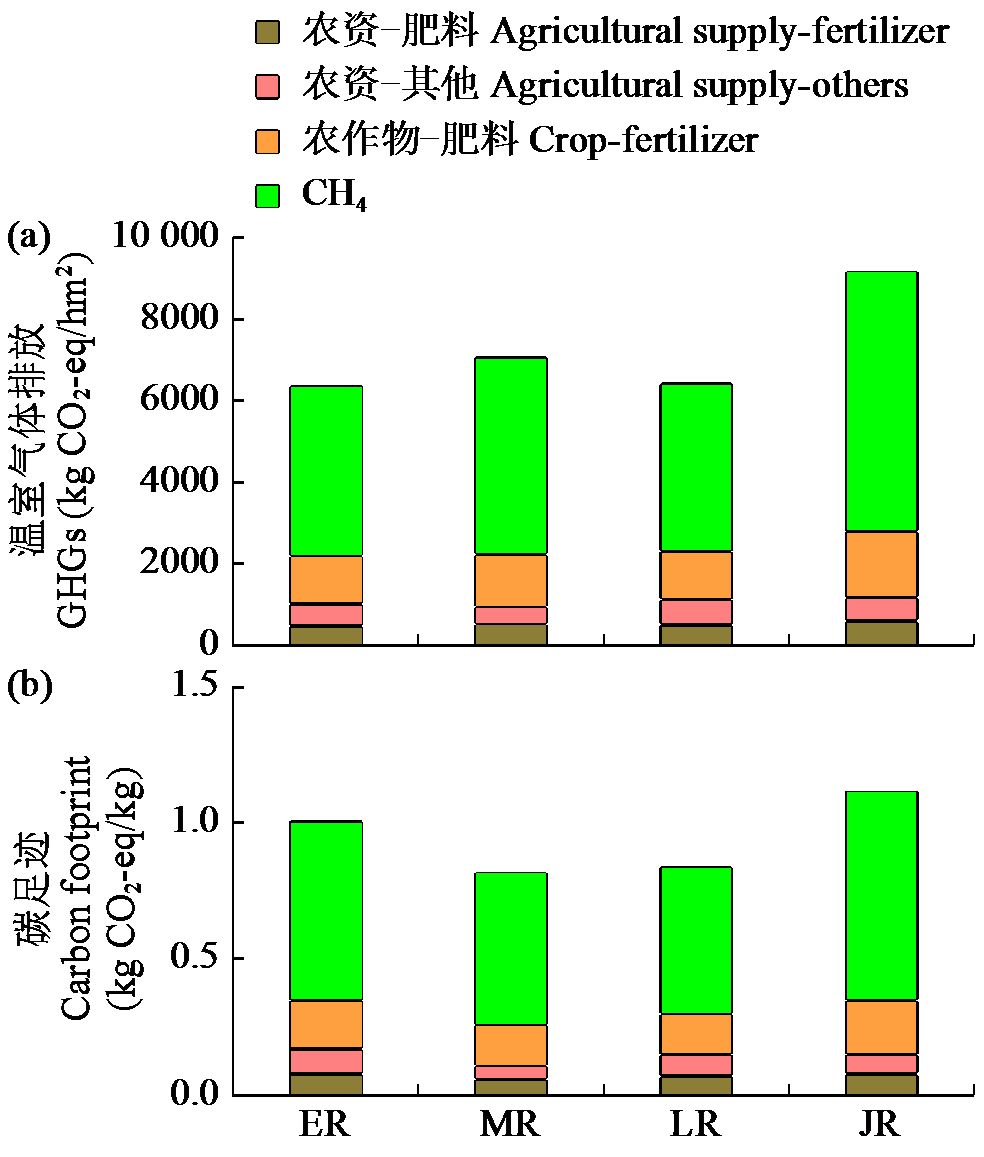
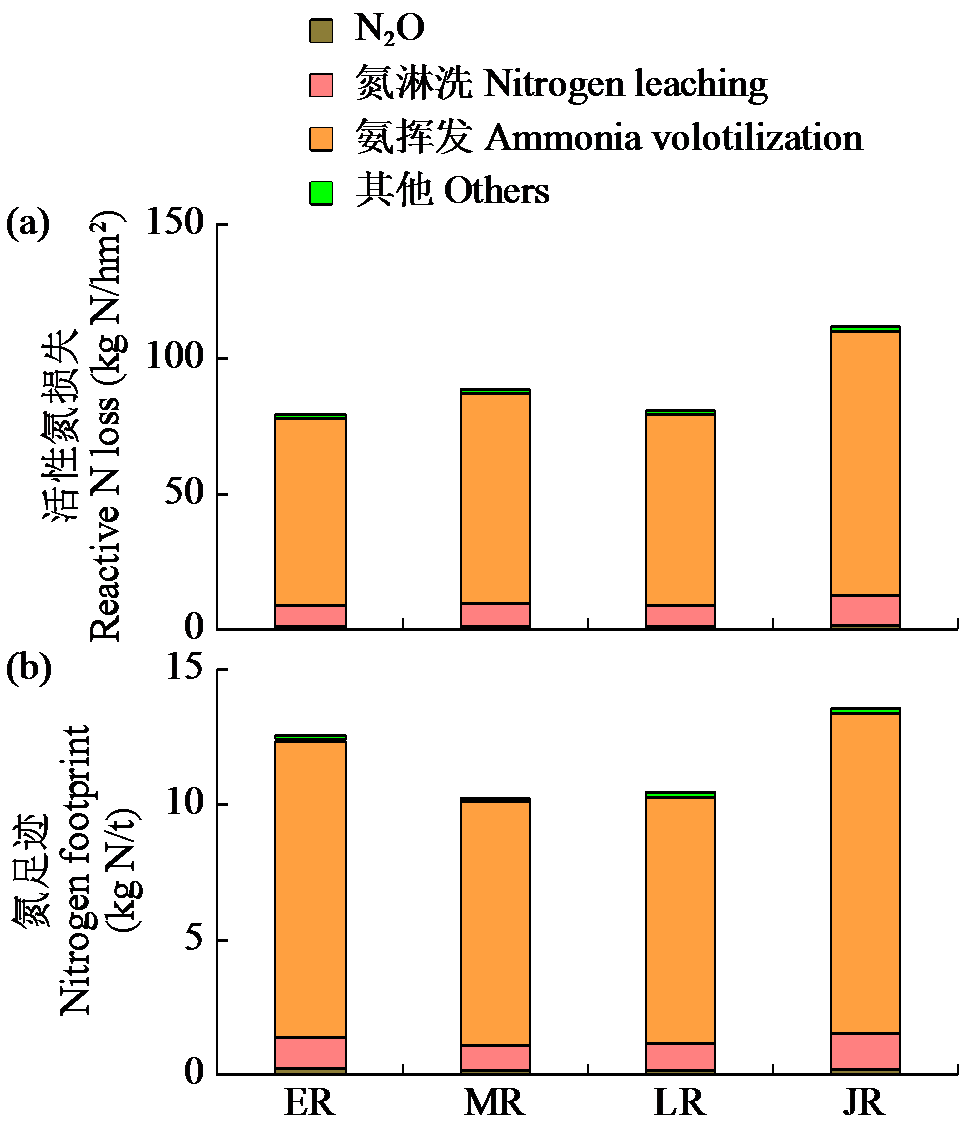
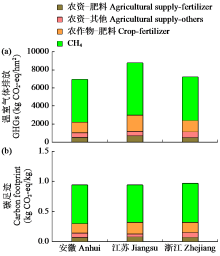
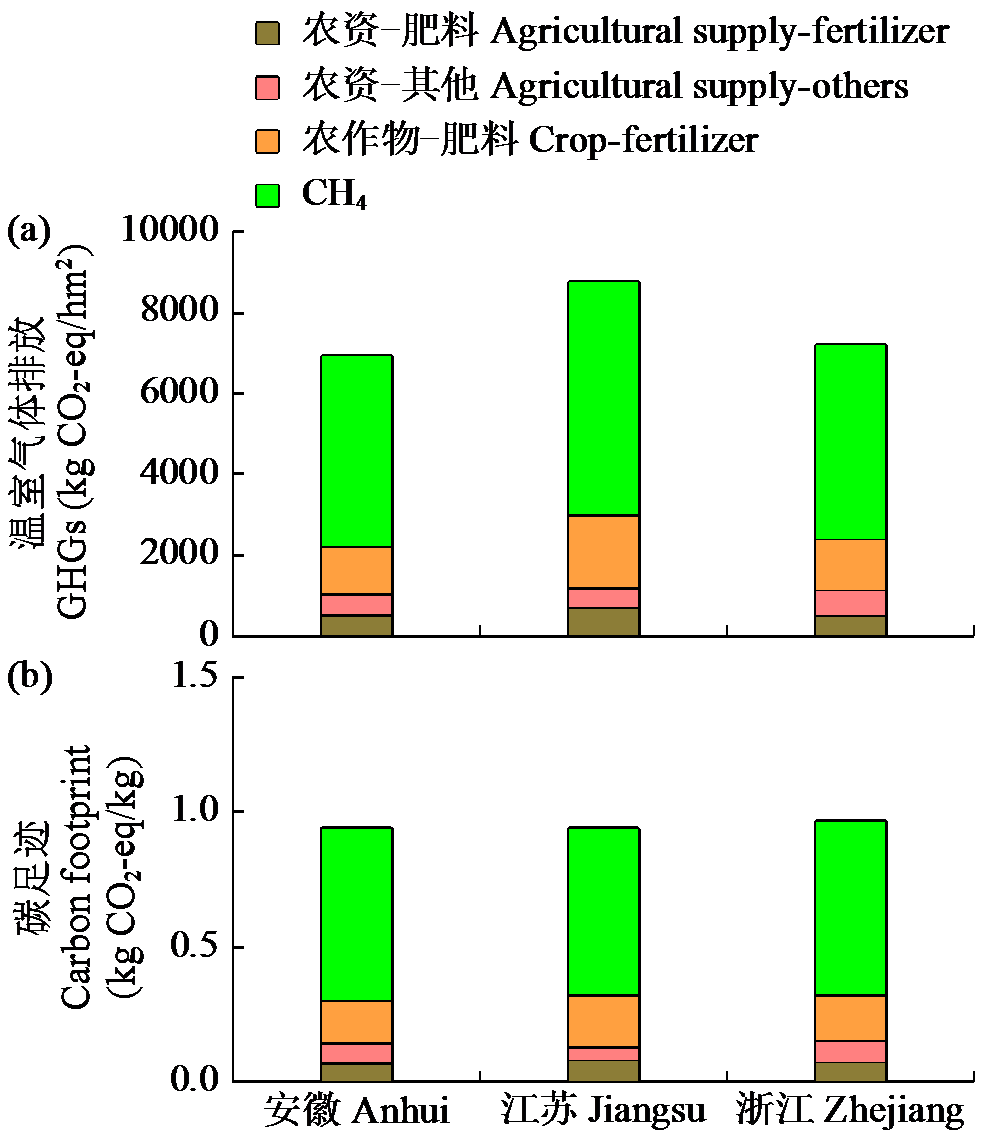
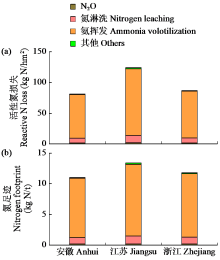
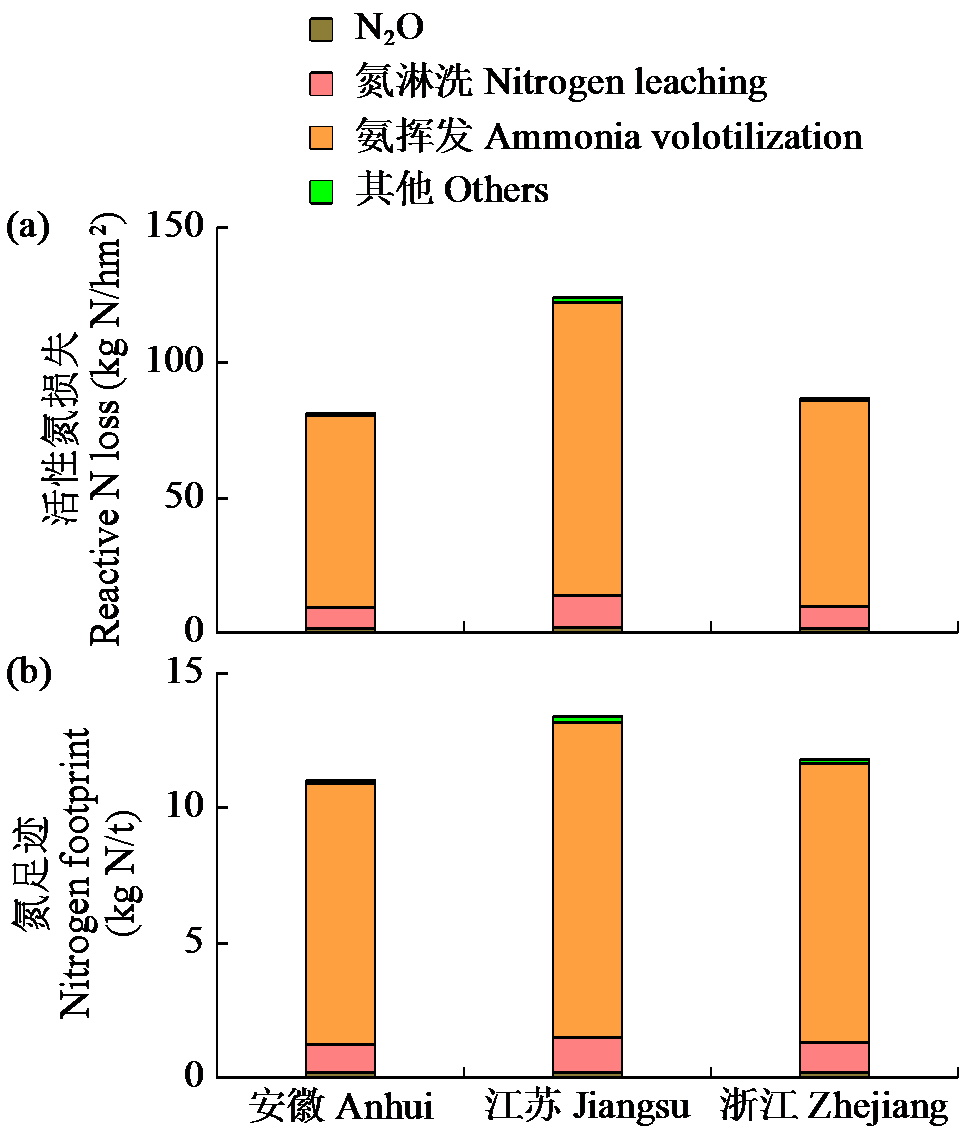
摘要: 长江三角洲地区是我国重要的粮食生产基地,定量该地区主要稻作类型水稻生产的资源投入和碳氮足迹可为水稻种植结构调整和绿色低碳生产提供数据支撑。利用2016-2020年统计数据,运用生命周期评价方法,研究了长江三角洲地区的苏、浙、皖3省主要稻作类型水稻生产的资源投入和碳氮足迹。结果表明,粳稻氮肥用量最高,为279 kg/hm2,碳、氮足迹最高,分别为1.11 kg CO2-eq/kg和13.7 kg N/t,产量较高。早籼稻氮肥用量最低,产量最低,分别为199 kg/hm2和6371 kg/hm2,碳、氮足迹处于中间水平。中籼稻产量最高,为8687 kg/hm2,碳、氮足迹最低,分别为0.82 kg CO2-eq/kg和10.3 kg N/t,氮肥用量处于中间水平。晚籼稻氮肥用量、产量及碳、氮足迹均处于中间水平。不同地区中江苏水稻氮肥用量最高,为309 kg/hm2,产量最高,为9319 kg/hm2,碳、氮足迹分别为0.948 kg CO2-eq/kg和13.5 kg N/t。浙江水稻氮肥用量为216 kg/hm2,产量7364 kg/hm2,碳、氮足迹分别为0.989 kg CO2-eq/kg和11.9 kg N/t。安徽水稻氮肥用量为204 kg/hm2,产量为7414 kg/hm2,碳、氮足迹分别为0.946 kg CO2-eq/kg和11.1 kg N/t。由此可知,粳稻投入产出较高,碳氮足迹最高,存在较大的减排空间。中籼稻的投入较低,产量最高,碳氮足迹最低,是可推广的稻作类型。江苏水稻产量最高,投入最高,氮足迹最高,浙江和安徽水稻投入产出差异较小,碳氮足迹差异较小。
| [1] | 国家统计局. 中国农业年鉴. 北京: 中国统计出版社, 2023. |
| [2] | Xia L L, Xia Y Q, Ma S T, et al. Greenhouse gas emissions and reactive nitrogen releases from rice production with simultaneous incorporation of wheat straw and nitrogen fertilizer. Biogeosciences, 2016, 13(15):4569-4579. |
| [3] | 徐文波. 减量施氮对优质杂交籼稻产量形成及品质的影响. 贵阳: 贵州大学, 2021. |
| [4] | Chen X P, Cui Z L, Fan M S, et al. Producing more grain with lower environmental costs. Nature, 2014, 514:486-489. |
| [5] | Bennetzen E H, Smith P, Porter J R. Agricultural production and greenhouse gas emissions from world regions—the major trends over 40 years. Global Environmental Change, 2016, 37:43-55. |
| [6] | 龚苏宁, 王业明, 刘荣桂. 我国将加强氨排放治理. 生态经济, 2020, 36(11):9-12. |
| [7] | He W T, Jiang R, He P, et al. Estimating soil nitrogen balance at regional scale in China’s croplands from 1984 to 2014. Agricultural Systems, 2018, 167:125-135. |
| [8] | Wang X Z, Liu B, Wu G, et al. Cutting carbon footprints of vegetable production with integrated soil-crop system management: a case study of greenhouse pepper production. Journal of Cleaner Production, 2020, 254,120158. |
| [9] | 季国军, 纪洪亭, 程琨, 等. 江苏稻田轮作模式碳、氮足迹分析. 南京农业大学学报, 2023, 46(3):510-521. |
| [10] |
张惠云, 秦丽杰, 贾利. 吉林省水稻生产的碳足迹与水足迹时空变化特征. 浙江农业学报, 2021, 33(6):974-983.
doi: 10.3969/j.issn.1004-1524.2021.06.02 |
| [11] | 陈中督, 徐春春, 纪龙, 等. 基于农户调查的长江流域双季稻生产碳、氮足迹分析—以江西和湖南为例. 作物杂志, 2023 (2):229-237. |
| [12] | 任筱童, 柴以潇, 张莹, 等. 县域稻麦轮作系统碳足迹分析——以江苏兴化为例. 中国土壤与肥料, 2023(4):67-75. |
| [13] | 国家发展和改革委员会价格司. 全国农产品成本收益资料汇编(2016-2020). 北京: 中国统计出版社, 2017-2021. |
| [14] | Cui Z L, Yue S C, Wang G L, et al. In-season root-zone N management for mitigating greenhouse gas emission and reactive N losses in intensive wheat production. Environmental Science & Technology, 2013, 47(11):6015-6022. |
| [15] | Huang X M, Chen C Q, Qian H Y, et al. Quantification for carbon footprint of agricultural inputs of grains cultivation in China since 1978. Journal of Cleaner Production, 2017, 142:1629-1637. |
| [16] | Zhang W F, Dou Z X, He P, et al. New technologies reduce greenhouse gas emissions from nitrogenous fertilizer in China. Proceedings of the National Academy of Sciences of the United States of America, 2013, 110:8375-8380. |
| [17] | 王桂良, 崔振岭, 陈新平, 等. 南方稻田活性氮损失途径及其影响因素. 应用生态学报, 2015, 26(8):2337-2345. |
| [18] | 陈祥龙. 中国水稻主产区产量与生育期特征参数时空分布研究. 南京: 南京农业大学, 2021. |
| [19] | 陈中督, 李凤博, 冯金飞, 等. 长江下游地区稻麦轮作模式碳足迹研究——基于生命周期评价. 中国农业资源与区划, 2019, 40(12):81-90. |
| [20] | 张志伟, 秦晓波, 樊建凌, 等. 干湿交替灌溉模式在湖南稻区适用性及其甲烷减排潜力评估. 农业工程学报, 2022, 38(增):232-239. |
| [21] | 薛建福. 耕作措施对南方双季稻田碳、氮效应的影响. 北京: 中国农业大学, 2015. |
| [22] |
Dijkstra F A, Morgan J A, Follett R F, et al. Climate change reduces the net sink of CH4 and N2O in a semiarid grassland. Global Change Biology, 2013, 19(6):1816-1826.
doi: 10.1111/gcb.12182 pmid: 23505264 |
| [23] | 许欣, 陈晨, 熊正琴. 生物炭与氮肥对稻田甲烷产生与氧化菌数量和潜在活性的影响. 土壤学报, 2016, 53(6):1517-1527. |
| [24] |
姚坚, 张世玺, 姚海根, 等. 氮肥用量对浙北地区不同类型晚粳品种产量及产量构成的影响. 中国稻米, 2018, 24(5):121-122.
doi: 10.3969/j.issn.1006-8082.2018.05.030 |
| [25] |
王兴, 赵鑫, 王钰乔, 等. 中国水稻生产的碳足迹分析. 资源科学, 2017, 39(4):713-722.
doi: 10.18402/resci.2017.04.12 |
| [26] | 白由路. 化学肥料与生态健康. 肥料与健康, 2020, 47(1):2-5. |
| [27] | Xia L L, Ti C P, Li B L, et al. Greenhouse gas emissions and reactive nitrogen releases during the life-cycles of staple food production in China and their mitigation potential. Science of the Total Environment, 2016, 556:116-125. |
| [28] |
官彩红, 王强, 孔祎昕, 等. 机插侧深施肥对水稻氮素吸收和氨挥发的影响. 浙江农业科学, 2022, 63(6):1215-1217,1222.
doi: 10.16178/j.issn.0528-9017.20213043 |
| [29] | 王贵兵. 机械侧深施肥对水稻生长、养分损失及肥料利用率的影响. 武汉: 华中农业大学, 2022. |
| [30] | 侯朋福, 薛利祥, 俞映倞, 等. 缓控释肥侧深施对稻田氨挥发排放的控制效果. 环境科学, 2017, 38(12):5326-5332. |
| [31] | 侯坤, 荣湘民, 韩磊, 等. 速效氮与缓控释氮配比一次性侧深施对双季稻产量、氮素利用率及氮素损失的影响. 农业环境科学学报, 2021, 40(9):1923-1934. |
| [1] | 陶祖豪, 王慰亲, 郑华斌, 向军, 唐启源. 水肥及化控对晚稻有序机抛秧秧苗素质的影响[J]. 作物杂志, 2025, (4): 224–230 |
| [2] | 赫兵, 王晓航, 李超, 罗立强, 张强, 韩康顺, 陈殿元, 严光彬, 刘振蛟. 1987-2022年吉林省水稻审定品种数据分析[J]. 作物杂志, 2025, (3): 16–22 |
| [3] | 曹正男, 赵振东, 胡博, 于涵, 宁晓海, 赵泽强, 曹立勇. 氮肥与促腐菌肥配施对寒地水稻秸秆还田腐解效果及产量的影响[J]. 作物杂志, 2025, (3): 172–177 |
| [4] | 李虎, 黄秋要, 吴子帅, 刘广林, 陈传华, 罗群昌, 朱其南. 种植密度和施氮量对优质常规稻桂育12产量和米质的影响[J]. 作物杂志, 2025, (3): 195–201 |
| [5] | 姬景红, 刘双全, 马星竹, 郝小雨, 郑雨, 赵月, 王晓军, 匡恩俊. 控释尿素对寒地水稻农艺性状、产量及氮肥利用率的影响[J]. 作物杂志, 2025, (2): 149–154 |
| [6] | 金丹丹, 隋世江, 陈玥, 李波, 曲航, 宫亮. 秸秆还田下氮肥减量对辽河平原水稻产量及氮素利用的影响[J]. 作物杂志, 2025, (2): 172–179 |
| [7] | 伍露, 张皓, 杨霏云, 郭尔静, 斯林林, 曹凯, 程陈. WOFOST模型对江淮地区水稻生长发育模拟的适应性评价[J]. 作物杂志, 2025, (2): 215–221 |
| [8] | 江素珍, 许超, 王中元, 郑沈, 陈建国, 朱捍华, 黄道友, 张泉, 朱奇宏. 海泡石和生物炭对水稻镉和砷吸收积累的影响[J]. 作物杂志, 2025, (2): 241–248 |
| [9] | 张家智, 赵羽涵, 丁俊杰, 姚亮亮, 邱磊, 张茂明, 王自杰, 高雪冬, 黄成亮, 崔士泽, 杨晓贺. “双免密苗”技术对寒地水稻秧苗素质及酶活性的影响[J]. 作物杂志, 2025, (2): 109–114 |
| [10] | 胡聪聪, 李红宇, 孙显龙, 王童, 赵海成, 范名宇, 张巩亮. 秸秆还田与氮肥运筹对寒地水稻光合特性和产量的影响[J]. 作物杂志, 2025, (1): 147–154 |
| [11] | 徐晓征, 王建军. 光周期影响水稻抽穗的分子机制研究进展[J]. 作物杂志, 2025, (1): 15–25 |
| [12] | 闫娜, 谢可冉, 高逖, 胡秋倩, 崔克辉. 增施穗氮肥缓解水稻穗分化期高温伤害的生理机制研究[J]. 作物杂志, 2025, (1): 89–98 |
| [13] | 法晓彤, 孟庆好, 王琛, 顾汉柱, 景文疆, 张耗. 水稻根系形态生理对干湿交替灌溉方式的响应研究进展[J]. 作物杂志, 2024, (6): 1–8 |
| [14] | 汪本福, 余振渊, 宋平原, 张作林, 张枝盛, 李阳, 苏章锋, 郑中春, 程建平. 土壤改良剂对低湖冷浸田土壤特性及水稻生长的影响[J]. 作物杂志, 2024, (6): 126–131 |
| [15] | 曾茜倩, 张振远, 马秀娥, 方映涵, 翟金磊, 金涛, 刘冬, 刘章勇. 硅藻土对水稻产量和氮肥利用率的影响[J]. 作物杂志, 2024, (6): 147–152 |
|
||