作物杂志,2019, 第2期: 128–135 doi: 10.16035/j.issn.1001-7283.2019.02.020

• 生理生化·植物营养·栽培耕作 • 上一篇    下一篇

玉米大豆间作种植密度耦合数学模型及其优化方案研究

代希茜1,詹和明1,崔兴洪2,赵银月1,单丹丹1,张亮1,王铁军1   

  1. 1 云南省农业科学院粮食作物研究所,650205,云南昆明
    2 会泽县农业技术推广中心,654200,云南曲靖
  • 收稿日期:2018-09-17 修回日期:2018-12-25 出版日期:2019-04-15 发布日期:2019-04-12
  • 通讯作者: 王铁军
  • 基金资助:
    国家大豆产业技术体系昆明综合试验站(CARS-04-CES29)

A Mathematical Model of Density Coupling and Its Optimization in Maize-Soybean Intercropping

Xixi Dai1,Heming Zhan1,Xinghong Cui2,Yinyue Zhao1,Dandan Shan1,Liang Zhang1,Tiejun Wang1   

  1. 1 Institute of Food Crops, Yunnan Academy of Agricultural Sciences, Kunming 650205, Yunnan, China
    2 Huize Agricultural Technology Extension Center, Qujing 654200, Yunnan,China
  • Received:2018-09-17 Revised:2018-12-25 Online:2019-04-15 Published:2019-04-12
  • Contact: Tiejun Wang

摘要:

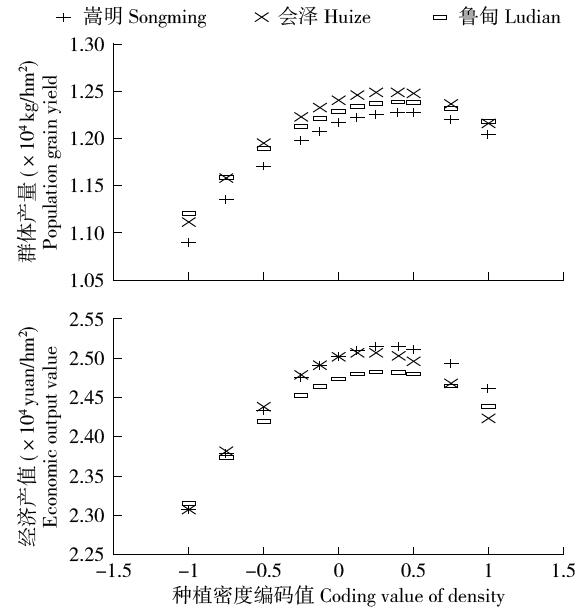
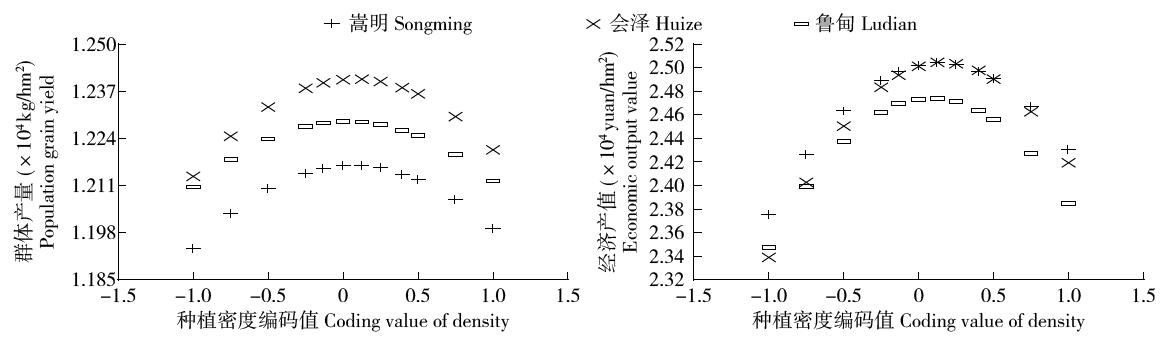
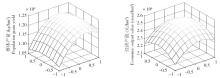
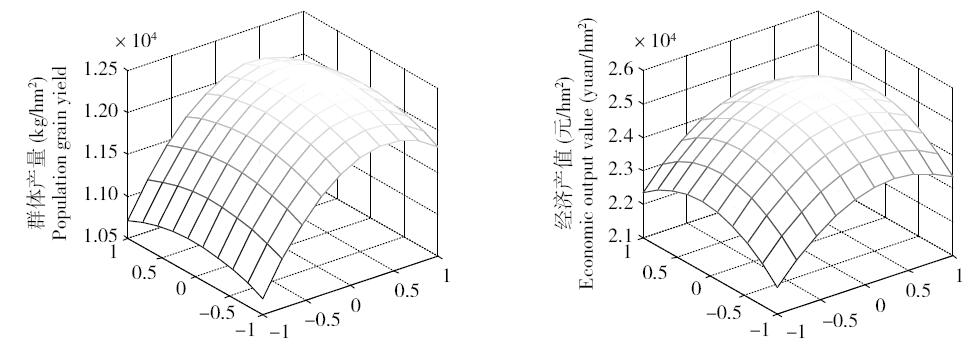
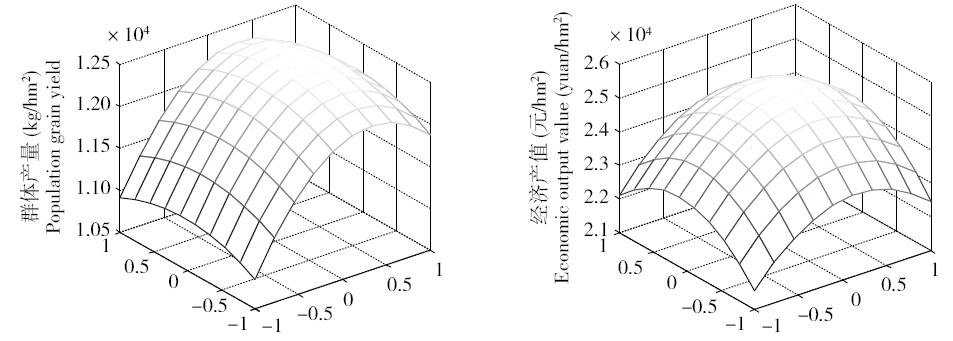
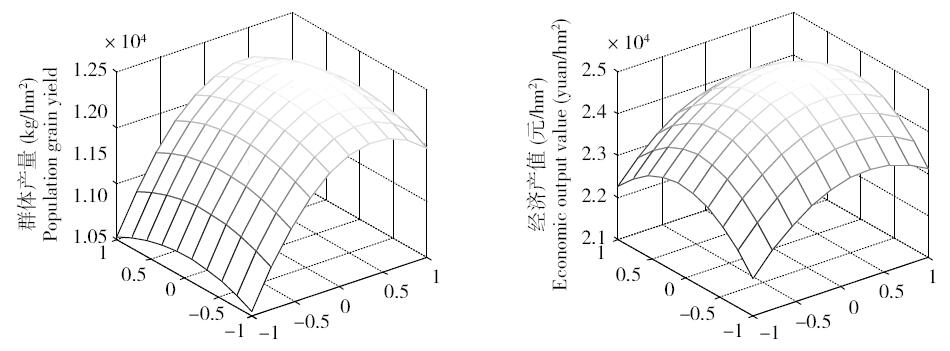
云南省大豆的种植主要以与玉米间作为主,适宜的种植密度是获得高产的前提,为研究种植密度对群体产量和经济产值的影响,找到最佳种植密度组合。采用二次饱和D-最优设计,分别在云南嵩明县(A)、会泽县(B)和鲁甸县(C)等3个点进行试验。研究了玉米和大豆种植密度对群体产量和经济产值的影响,并分别建立二元二次数学模型。结果表明:玉米和大豆密度对间作群体产量和经济产值影响显著,均呈凸抛物线型变化,在低密度水平下,群体产量和经济产值随密度的增加而增加。通过模型解析表明,玉米+大豆密度组合分别为64 110株/hm 2+147 013株/hm 2(A)、63 068株/hm 2+147 116株/hm 2(B)、64 059株/hm 2+145 077株/hm 2(C)时,各试验点可分别达到最高群体产量。玉米+大豆密度组合分别为62 909株/hm 2+149 852株/hm 2(A)、61 499株/hm 2+151 807株/hm 2(B)、62 762株/hm 2+147 108株/hm 2(C)时,各试验点可分别达到最高产值。经模拟得出,在本试验条件下,各试验点玉米大豆间作群体产量≥12 270kg/hm 2、经济产值≥24 000元/hm 2的最佳密度组合分别为玉米59 251~66 437株/hm 2、大豆140 075~161 495株/hm 2(A),玉米58 927~65 366株/hm 2、大豆144 159~169 203株/hm 2(B),玉米58 821~66 703株/hm 2、大豆139 315~154 886株/hm 2(C)。合理的密度搭配能有效提高群体产量,获得较高经济产值。

关键词: 玉米, 大豆, 间作, 种植密度耦合, 数学模型, 优化方案

Abstract:

Maize and soybean intercropping planting is mainly composed of soybean planting in Yunnan Province. In order to achieve high yield of maize and soybean intercropping system, we must have suitable planting density. The effect of planting density on population grain yield and economic output value was studied with the design of the double saturated D-optimal regression, which was tested at three sites including Songming County (A), Huize County (B) and Ludian County (C), respectively. And a binary quadratic mathematical model was established, in which the planting densities of maize and soybean were independent variables, and population grain yield and economic output value were dependent variables. The results showed that the planting density of maize and soybean on population grain yield and economic output value of intercropping group effect significantly, and the change curve was a convex parabola. The population yield and economic output increased with density under the low level of density. According to model analysis, each test site could reach the highest population grain yield with the optimized combination of maize 64 110 plant/hm 2+ soybean 147 013 plant/hm 2 (A), maize 63 068 plant/hm 2+soybean 147 116 plant/hm 2 (B) and maize 64 059 plant/hm 2+soybean 145 077 plant/hm 2 (C), respectively. Each test site could reach the highest economic output value with the optimized combination of maize 62 909 plant/hm 2+soybean 149 852 plant/hm 2 (A), maize 61 499 plant/hm 2+soybean 151 807 plant/hm 2 (B) and maize 62 762 plant/hm 2+soybean 147 108 plant/hm 2 (C), respectively. According computer simulation, the optimum combination of densities of maize and soybean were 59 251-66 437 plant/hm 2 for maize and 140 075-161 495 plant/hm 2 for soybean (A), 58 927-65 366 plant/hm 2 for maize and 144 159-169 203 plant/hm 2 for soybean (B), 58 821-66 703 plant/hm 2 for maize and 139 315-154 886 plant/hm 2 for soybean (C) in order to obtain population grain yield greater than 12 270kg/hm 2 and economic output value greater 24 000 yuan/hm 2 under the condition of this experiment. A reasonable density collocation can effectively increase population yield and economic output value.

Key words: Maize, Soybean, Intercropping, Planting density coupling, Mathematics model, Optimization scheme

表1

密度配置的水平编码值和田间实际值"

处理
Treatment
水平编码值
Level coding value
田间实际值(株/hm2)
Field actual value (plant/hm2)
玉米
Maize
大豆
Soybean
玉米
Maize
大豆
Soybean
T1 -1 -1 44 978 89 955
T2 -1 -1 71 964 89 955
T3 -1 -1 44 978 194 903
T4 -0.1315 -0.1315 56 696 135 528
T5 -0.3944 -1 63 793 194 903
T6 -1 -0.3944 71 964 163 124

表2

各试验点群体复合产量统计分析"

处理
Treatment
嵩明Songming 会泽Huize 鲁甸Ludian
玉米
Maize
大豆
Soybean
群体
Total
玉米
Maize
大豆
Soybean
群体
Total
玉米
Maize
大豆
Soybean
群体
Total
T1 9 499.3a 1 201.3de 10 700.6d 9 778.8c 1 078.1d 10 856.9d 9 960.5d 1 084.5e 11 045.0d
T2 10 655.5b 1 144.7e 11 800.2b 10 984.5ab 888.7e 11 873.2b 10 967.0c 1 011.5f 11 978.5b
T3 9 373.4a 1 338.5bc 10 711.9d 9 713.1c 1 194.0c 10 907.1d 9 835.6e 1 186.4d 11 022.0d
T4 10 651.3b 1 419.2b 12 070.5a 10 991.5ab 1 318.6b 12 310.1a 10 909.6c 1 298.4b 12 207.9a
T5 10 822.6ab 1 293.4cd 12 116.0a 11 121.1a 1 175.9c 12 297.0a 11 108.0b 1 121.4e 12 229.4a
T6 10 669.9b 1 363.2bc 12 033.1ab 10 893.5b 1 240.4c 12 133.9a 10 880.6c 1 236.9c 12 164.9a
SS - 3 582.2a 3 582.2e - 3 568.2a 3 568.2e - 3 647.2a 3 647.2e
MM 11 023.7a - 11 023.7c 11 155.9a - 11 155.9c 11 223.4a - 11 223.4c

表3

各试验点群体经济产值统计分析"

处理
Treatment
嵩明Songming 会泽Huize 鲁甸Ludian
玉米
Maize
大豆
Soybean
群体
Total
玉米
Maize
大豆
Soybean
群体
Total
玉米
Maize
大豆
Soybean
群体
Total
T1 15 198.8c 6 607.1de 21 805.9c 15 646.1c 5 929.4d 21 575.5d 15 936.8d 5 964.5e 21 901.3f
T2 17 048.8b 6 296.0e 23 344.7b 17 575.2ab 4 887.8e 22 463.0c 17 547.2c 5 563.2f 23 110.4d
T3 14 997.3c 7 361.9bc 22 359.2c 15 541.0c 6 566.7c 22 107.8c 15 736.9e 6 525.2d 22 262.2e
T4 17 042.2b 7 805.4b 24 847.6a 17 586.4ab 7 252.6b 24 839.0a 17 455.3c 7 140.9b 24 596.2a
T5 17 316.1ab 7 113.6cd 24 429.7a 17 793.7a 6 467.5c 24 261.3b 17 772.7b 6 167.9e 23 940.6c
T6 17 071.8b 7 497.6bc 24 569.4a 17 429.7b 6 822.1c 24 251.8b 17 484.9c 6 802.8c 24 287.7b
SS - 19 699.4a 19 699.4d - 19 625.2a 19 625.2e - 20 059.5a 20 059.5g
MM 17 638.4a - 17 638.4e 17 849.5a - 17 849.5f 17 957.4a - 17 957.4h

表4

各试验点群体产量(Y)与玉米密度(X1)和大豆密度(X2)的回归方程"

回归方程Regression equation
YA=12163.87+570.1X1+25.9X2-688.03X12-199.59X22+20.25X1X2(P<0.01,R=1.000)
YB=12400.3+519.56X1+36.51X2-769.15X12-229.58X22+11.41X1X2(P<0.01,R=1.000)
YC=12285.96+486.93X1+8.68X2-592.45X12-173.09X22+20.18X1X2(P<0.01,R=1.000)

表5

各试验点经济产值(Z)与玉米密度(X1)和大豆密度(X2)的回归方程"

回归方程 Regression equation
ZA=25022.86+770.11X1+277.36X2-1179.07X12-991.13X22+0.71X1X2(P<0.01,R=1.000)
ZB=25010.89+581.26X1+403.66X2-1363.3X12-1224.68X22+137.51X1X2(P<0.01,R=1.000)
ZC=24736.32+610.88X1+186.78X2-968.45X12-1075.29X22+6.33X1X2(P<0.01,R=1.000)

图1

玉米种植密度对群体产量和经济产值的单因素效应分析"

图2

大豆种植密度对群体产量和经济产值的单因素效应分析"

图3

嵩明种植密度对群体产量和经济产值的互作效应"

图4

会泽种植密度对群体产量和经济产值的互作效应"

图5

鲁甸种植密度对群体产量和经济产值的互作效应"

表6

各试验点优化方案的相关参数"

优化目标
Optimal target value
相关参数
Relevant parameter
嵩明Songming 会泽Huize 鲁甸Ludian
X1 X2 X1 X2 X1 X2
群体产量≥12 270kg/hm2
Population grain yield ≥12 270kg/hm2
优化方案数
Optimization scheme
14 18 19
平均值Mean 0.3270 0.0751 0.2397 0.0584 0.2797 0.1080
标准误Standard error 0.1132 0.1198 0.0962 0.1472 0.0994 0.1478
95%的置信区间
95% confidence interval
0.0824~0.5716 -0.1837~0.3339 0.0368~0.4426 -0.2521~0.3690 0.0709~0.4885 -0.2025~0.4185
种植密度(株/hm2)
Planting density
(plant/hm2)
59 612~66 216 132 855~160 032 58 997~64 475 129 263~161 871 59 457~65 095 131 868~164 470
经济产值≥24 000元/hm2
Economic output value ≥24000 yuan/hm2
优化方案数
Optimization scheme
15 15 12
平均值Mean 0.2701 0.2701 0.2701 0.2701 0.3157 0.0876
标准误Standard error 0.1112 0.1112 0.1112 0.1112 0.1326 0.0674
95%的置信区间
95% confidence interval
0.0316~0.5086 0.0316~0.5086 0.0316~0.5086 0.0316~0.5086 0.0238~0.6077 -0.0607~0.2359
种植密度(株/hm2)
Planting density
(plant/hm2)
58 927~65 366 144 159~169 203 58 927~65 366 144 159~169 203 58 821~66 703 139 315~154 886

表7

群体产量≥12 270kg/hm2、经济产值≥24 000元/hm2的优化组合频数分析"

变量
Variable
嵩明Songming 会泽Huize 鲁甸Ludian
X1 X2 X1 X2 X1 X2
次数
Times
频率
Frequency
次数
Times
频率
Frequency
次数
Times
频率
Frequency
次数
Times
频率
Frequency
次数
Times
频率
Frequency
次数
Times
频率
Frequency
-1 0 0 0 0 0 0 0 0 0 0 0 0
-0.1315 3 0.2308 4 0.3077 4 0.2667 4 0.2667 3 0.25 4 0.3333
0 3 0.2308 4 0.3077 4 0.2667 4 0.2667 3 0.25 4 0.3333
0.3944 4 0.3077 4 0.3077 4 0.2667 4 0.2667 3 0.25 4 0.3333
1 3 0.2308 1 0.0769 3 0.2000 3 0.2000 3 0.25 0 0
合计 Total 13 1 13 1 15 1 15 1 12 1 12 1
平均值 Mean 0.3218 0.1578 0.2701 0.2701 0.3157 0.0876
标准误 Standard error 0.1222 0.0936 0.1112 0.1112 0.1326 0.0674
95%置信区间
95% confidence interval
0.0556~0.5879 -0.0462~0.3618 0.0316~0.5086 0.0316~0.5086 0.0238~0.6077 -0.0607~0.2359
种植密度(株/hm2)
Plant density (plant/hm2)
59 251~66 437 140 075~161 495 58 927~65 366 144 159~169 203 58 821~66 703 139 315~154 886
[1] Yang F, Liao D, Wu X . Effect of aboveground and belowground interactions on the intercrop yields in maize-soybean relay intercropping systems. Field Crops Research, 2017,203:16-23.
doi: 10.1016/j.fcr.2016.12.007
[2] Gou F, Yin W, Hong Y . On yield gaps and yield gains in intercropping: Opportunities for increasing grain production in northwest China. Agricultural Systems, 2017,151:96-105.
doi: 10.1016/j.agsy.2016.11.009
[3] Ren Y, Liu J, Wang Z . Planting density and sowing proportions of maize-soybean intercrops affected competitive interactions and water-use efficiencies on the Loess Plateau,China. European Journal of Agronomy, 2016,72:70-79.
doi: 10.1016/j.eja.2015.10.001
[4] Liu X, Rahman T, Song C . Changes in light environment,morphology,growth and yield of soybean in maize-soybean intercropping systems. Field Crops Research, 2017,200:38-46.
doi: 10.1016/j.fcr.2016.10.003
[5] 方传文 . 玉豆间作条件下大豆生长和生理特性研究. 南京:南京农业大学, 2014.
[6] 周新安, 年海, 杨文钰 , 等. 南方间套作大豆生产发展的现状与对策(Ⅱ). 大豆科技, 2017(4):1-3.
doi: 10.3969/j.issn.1674-3547.2010.05.001
[7] 高阳, 段爱旺, 刘祖贵 , 等. 单作和间作对玉米和大豆群体辐射利用率及产量的影响. 中国生态农业学报, 2009,17(1):7-12.
doi: 10.3724/SP.J.1011.2009.00007
[8] 刘艳昆, 阎旭东, 徐玉鹏 , 等. DTOPSIS法综合评价玉米间作大豆的密度配置和品种选择. 天津农业科学, 2014,20(11):83-87.
doi: 10.3969/j.issn.1006-6500.2014.11.019
[9] 雍太文, 杨文钰, 向达兵 , 等. 玉/豆套作模式下玉米播期与密度对大豆农艺性状及产量的影响. 大豆科学, 2009,28(3):439-444.
doi: 10.11861/j.issn.1000-9841.2009.03.0439
[10] Echarte L, Maggiora A D, Cerrudo D . Yield response to plant density of maize and sunflower intercropped with soybean. Field Crops Research, 2011,121(3):423-429.
doi: 10.1016/j.fcr.2011.01.011
[11] 林绍森, 唐永金 . 玉米密度、行距和穴距对间作大豆光合速率的效应分析. 大豆科学, 2007,26(2):149-153.
doi: 10.3969/j.issn.1000-9841.2007.02.006
[12] 谭春燕, 刘作易, 朱星陶 , 等. 不同密度间作大豆的光合生理响应. 贵州农业科学, 2012,40(8):49-52.
doi: 10.3969/j.issn.1001-3601.2012.08.015
[13] 朱元刚, 高凤菊, 曹鹏鹏 , 等. 种植密度对玉米-大豆间作群体产量和经济产值的影响. 应用生态学报, 2015,26(6):1751-1758.
[14] 吴兰 . 密度、带型与播差期对玉米间作大豆产量及品质的影响研究. 贵阳:贵州大学, 2007.
doi: 10.7666/d.y1188291
[15] 吕越 . 玉米/大豆种内与种间作物的资源竞争. 杨凌:西北农林科技大学, 2014.
[16] 焦志勇, 周绍美 . 二次饱和D-最优设计. 山东农业科学, 2017(2):46-49.
[17] 刘伟明 . 二次饱和D-最优设计在甘薯栽培试验中的应用. 安徽农业科学, 2011,39(35):21625-21626.
doi: 10.3969/j.issn.0517-6611.2011.35.024
[18] 肖俊璋, 冯固, 何尚仁 , 等. 应用二次饱和D-最优设计研究肥料效应方程. 土壤通报, 2017(1):27-30.
[19] 林堃, 李绍武 . 应用二次回归饱和D-最优设计研究甘蔗氮、磷、钾肥料效应. 甘蔗糖业, 2017(5):9-15.
[20] 马国胜, 薛吉全, 路海东 , 等. 播种时期与密度对关中灌区夏玉米群体生理指标的影响. 应用生态学报, 2007,18(6):1247-1253.
[21] 曹鲜艳, 徐福利, 王渭玲 , 等. 黄芩产量和黄芩苷含量对氮磷钾肥料的响应. 应用生态学报, 2012,23(8):2171-2177.
[22] 代希茜, 詹和明, 赵银月 , 等. 玉/豆间作模式下幅宽和玉米密度配置优化研究. 西南农业学报, 2018,31(1):39-43.
doi: 10.16213/j.cnki.scjas.2018.1.007
[1] 张冬梅,黄学芳,姜春霞,张伟,王晓娟,刘化涛,闫六英,刘恩科,翟广谦. 冷凉区旱地玉米微垄覆膜土壤水热及产量效应研究[J]. 作物杂志, 2019, (2): 115–121
[2] 张宇飞,刘立志,马昱萱,王晓纯,戴建军. 耕作和秸秆还田方式对玉米产量及钾素积累转运的影响[J]. 作物杂志, 2019, (2): 122–127
[3] 史亚兴,徐丽,赵久然,卢柏山,樊艳丽. 中国糯玉米产业优势及在“一带一路”发展中的机遇[J]. 作物杂志, 2019, (2): 15–19
[4] 孙丽娟,赵志宏,贺娟,王步军. 我国鲜食玉米相关标准问题分析及对策[J]. 作物杂志, 2019, (2): 46–50
[5] 林春雨,梁晓宇,赵慧艳,王洋. 黑龙江省主栽大豆品种遗传多样性和群体结构分析[J]. 作物杂志, 2019, (2): 78–83
[6] 唐会会,许艳丽,王庆燕,马正波,李光彦,董会,董志强. 叶面喷施5-氨基乙酰丙酸对不同密度春玉米生长特性和产量的影响[J]. 作物杂志, 2019, (2): 136–141
[7] 张翼飞,于崧,王玉凤,杨克军,郭庄园,李瑶,孙逸珊,贾文宝,张亚凤. 促进玉米子粒脱水的农艺措施研究进展[J]. 作物杂志, 2019, (1): 1–8
[8] 刘博,卫玲,肖俊红,杨海峰,段学艳,陈爱萍,任瑞兰. 关于提高大豆杂交结实率的研究[J]. 作物杂志, 2019, (1): 81–84
[9] 梁茜,刘文亚,葛均筑,赵明,侯海鹏,杨永安,辛德财. 条带深旋小双行精播技术对夏玉米产量调控效应研究[J]. 作物杂志, 2019, (1): 111–115
[10] 张洋,于惠琳,王延波. 东华北不同生态区玉米品种产量及相关性状差异研究[J]. 作物杂志, 2019, (1): 38–43
[11] 李悦,李海燕,于吉东,邓杰,宫远福,朱俊澍. 线麻秸秆浸提液对大豆的化感作用[J]. 作物杂志, 2019, (1): 175–179
[12] 李昊胜,李岩,吴承来,赵林茂,张春庆. 花后DA-6处理对玉米自交系郑58种子活力的影响[J]. 作物杂志, 2019, (1): 186–191
[13] 李伟堂,李洋,牛海龙,刘红欣,牟书靓,何中国,李玉发. 单粒播种模式下不同种衣剂对玉米种子出苗率的影响[J]. 作物杂志, 2019, (1): 191–196
[14] 田礼欣,杨晔,左师宇,刘旋,魏湜,孙磊,李晶. 脱落酸对低温胁迫下玉米幼苗生长和光合特性的影响[J]. 作物杂志, 2018, (6): 76–82
[15] 张韶昀,李向岭,刘盼,张悦,翟大帅,尹宝重. 土壤耕作与施肥配合对玉米根系微观结构及产量的影响[J]. 作物杂志, 2018, (6): 144–148
Viewed
Full text


Abstract

Cited

  Shared   
  Discussed   
[1] 赵广才,常旭虹,王德梅,陶志强,王艳杰,杨玉双,朱英杰. 小麦生产概况及其发展[J]. 作物杂志, 2018, (4): 1 –7 .
[2] 陆梅,孙敏,任爱霞,雷妙妙,薛玲珠,高志强. 喷施叶面肥对旱地小麦生长的影响及与产量的关系[J]. 作物杂志, 2018, (4): 121 –125 .
[3] 李志刚, 董丽杰, 宋书宏, 等. 磷素和干旱胁迫对大豆叶片活性氧和保护酶系统的影响[J]. 作物杂志, 2007, (6): 35 –37 .
[4] 王晓飞,徐海军,郭梦桥,肖宇,程薪宇,刘淑霞,关向军,吴耀坤,赵伟华,魏国江. 播期、密度及施肥对寒地油用型紫苏产量的影响[J]. 作物杂志, 2018, (4): 126 –130 .
[5] 李少昆,张万旭,王克如,俞万兵,陈永生,韩冬生,杨小霞,刘朝巍,张国强,王浥州,柳枫贺,陈江鲁,杨京京,谢瑞芝,侯鹏,明博. 北疆玉米密植高产宜粒收品种筛选[J]. 作物杂志, 2018, (4): 62 –68 .
[6] 林金忠. 介绍三个水稻病害抗源材料[J]. 作物杂志, 1987, (1): 23 .
[7] 张晓勇,杨友联,李树江,熊荣川,向红. 外源激素对低温胁迫下脱毒马铃薯扦插苗早衰的影响[J]. 作物杂志, 2018, (4): 95 –101 .
[8] 廖红蕖,陈红丽,范文思,陈宇,韩秋静,于建军,马明. 河南主产烟区土壤颗粒分形特征及对烟叶理化性状的影响[J]. 作物杂志, 2018, (1): 118 –125 .
[9] 朱佳妮,代惠萍,魏树和,贾根良,陈德经,裴金金,张庆,强龙. 花期追施锌肥对大豆生长和锌素积累的影响[J]. 作物杂志, 2018, (1): 152 –155 .
[10] 郜战宁,冯辉,薛正刚,杨永乾,王树杰,潘正茂. 28个大麦品种(系)主要农艺性状分析[J]. 作物杂志, 2018, (1): 77 –82 .