Crops ›› 2023, Vol. 39 ›› Issue (3): 66-74.doi: 10.16035/j.issn.1001-7283.2023.03.009

Previous Articles     Next Articles

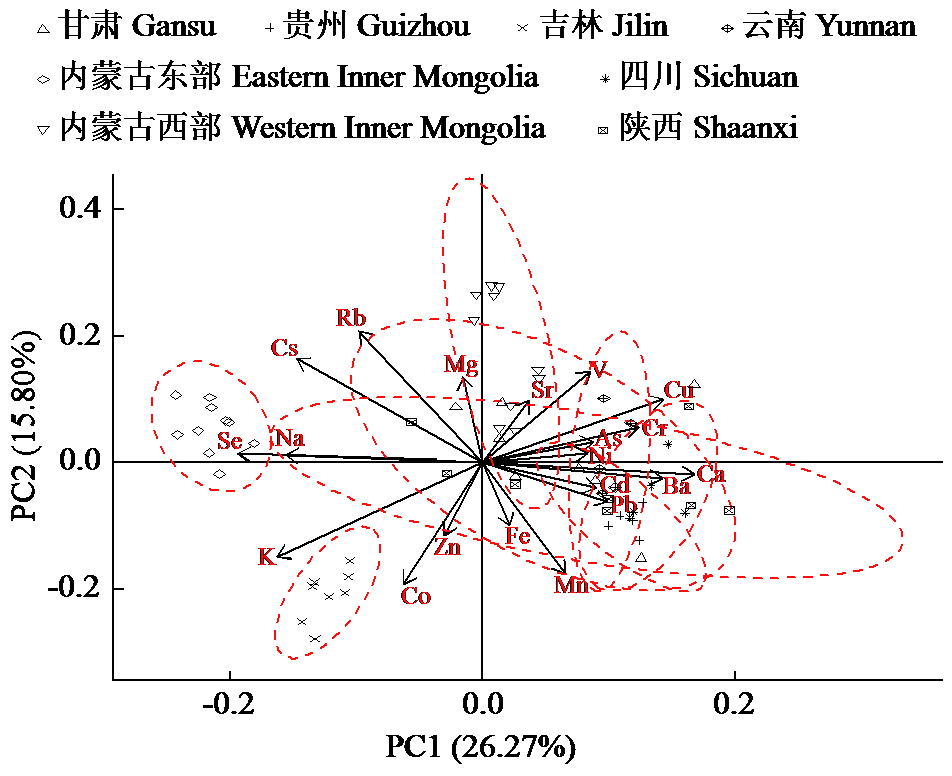
Study on Geographical Origin of Buckwheat Based on Mineral Element Fingerprint

Zhang Yufen1(), Qi Jingkai1(), Wang Guiling2, Zhao Baoping3, Zhou Lei4   

  1. 1Life Science College of Inner Mongolia Minzu University, Tongliao 028043, Inner Mongolia, China
    2Zhalantun Green Industry Development Center, Zhalantun 162650, Inner Mongolia, China
    3Agriculture College of Inner Mongolia Agricultural University, Hohhot 010019, Inner Mongolia, China
    4Agriculture College of Inner Mongolia Minzu University, Tongliao 028043, Inner Mongolia, China
  • Received:2021-08-31 Revised:2022-01-15 Online:2023-06-15 Published:2023-06-16

Abstract:

The contents of 20 elements including Na, Mg, K, Ca, V, Cr, Mn, Fe, Co, Ni, Cu, Zn, Se, Sr, Rb, Cs, Ba, As, Cd and Pb in buckwheats produced from eight regions were determined by microwave digestion inductively coupled plasma mass spectrometry (ICP-MS). The main mineral elements affecting buckwheat producing areas were selected by correlation analysis, significance analysis and principal component analysis. Buckwheat from different producing areas were classified by cluster analysis and discriminant analysis. The results showed that there were significant differences of different producing areas from other elements, except V and Cs, buckwheat from different producing areas had its unique mineral element fingerprint information. The five elements, Rb, Sr, Co, Ba and Cr, were screened out by stepwise discriminant analysis, the overall discriminant rates of buckwheat producing areas were 93.3% and 98.3%, respectively, by cross validation test and original test. Therefore, mineral element fingerprint combined with chemometrics could identify buckwheat from different producing areas, which provided technical support for the study of geographical origin of buckwheat.

Key words: Buckwheat, Mineral element fingerprint, ICP-MS, Chemometrics, Origin identification

Table 1

Regression equation, correlation coefficient, the average recovery rates, RSD, LOD and LOQ of 20 elements"

元素
Element
方程
Regression equation
相关系数
r
平均回收率
Average recovery rate (%)
相对标准偏差
RSD (%)
检出限
LOD (ng/L)
定量限
LOQ (ng/L)
Na y=2.3434×10⁻²x+1.7451×10⁻³ 0.9998 104.03 3.58 0.02 0.06
Mg y=1.4054×10⁻²x+6.1057×10⁻³ 0.9994 99.36 2.25 0.23 0.69
K y=9.4088×10⁻³x+1.3102×10⁻³ 0.9999 103.44 3.51 0.27 0.81
Ca y=2.7369×10⁻²x+2.7185×10⁻³ 0.9995 103.15 2.38 0.27 0.81
V y=26595x-2315 0.9999 97.66 1.03 0.12 0.36
Cr y=21732x+16741 0.9999 96.43 1.29 0.14 0.42
Mn y=29948x+24815 0.9999 100.32 1.35 0.17 0.52
Fe y=638.2x+30613 0.9991 100.22 1.26 0.49 1.47
Co y=1167.32x+53559.43 0.9997 98.64 1.81 0.04 0.12
Ni y=5929x+3726 0.9998 97.85 0.81 0.43 1.30
Cu y=12482x+14115 0.9999 99.94 0.65 0.06 0.18
Zn y=3735x+16733 0.9995 102.67 1.39 0.63 1.89
As y=3657x+5919 0.9998 97.25 0.54 0.48 1.45
Se y=409x-154 0.9998 99.11 0.83 1.25 3.75
Rb y=29523x+4150 0.9999 99.84 1.24 1.01 3.03
Sr y=38416x+15168 0.9995 95.37 3.14 0.03 0.09
Cd y=3297x+1346 0.9999 99.84 1.43 0.08 0.24
Cs y=33083x+1099 0.9999 98.22 1.36 0.11 0.33
Ba y=27186x+42380 0.9996 96.43 1.67 0.06 0.18
Pb y=10495x+1280 0.9998 101.28 1.62 0.07 0.21

Table 2

Contents of mineral elements in buckwheat"

元素
Element
含量
Content (mg/kg)
最小值
Minimum
最大值
Maximum
偏度
Skewness
峰度
Kurtosis
P 变异系数
CV (%)
Na 80.11(68.66, 105.54) 27.45 179.29 0.61 -0.70 0.04 44.37
Mg 2344.10±227.74 1800.93 2672.05 -0.47 -0.11 0.44 9.72
K 4456.92±972.21 2368.55 6807.71 0.11 0.60 0.96 21.81
Ca 103.54±48.85 33.52 212.50 0.28 -0.79 0.27 47.18
Fe 28.38±7.46 18.37 47.07 0.61 -0.12 0.15 26.29
Mn 31.95±8.23 18.86 48.07 0.42 -0.39 0.36 25.76
Cu 8.07(13.49, 28.28) 6.23 60.55 2.87 8.52 0.00 58.39
Zn 16.97±5.18 8.07 29.01 -0.49 -0.35 0.90 30.52
Se 0.04(0.04, 0.09) 0.00 0.19 1.64 1.46 0.00 72.64
Ni 5.29±1.09 3.69 8.06 0.85 0.36 0.11 20.60
Cr 0.84(0.66, 1.10) 0.17 2.20 1.11 0.91 0.03 53.01
Co 0.56(0.39, 0.73) 0.09 1.87 1.70 3.35 0.00 102.27
V 0.11(0.04, 0.18) 0.01 0.82 3.44 13.83 0.00 105.59
Rb 20.76±10.45 4.70 41.22 0.43 -0.88 0.25 50.34
Sr 3.87±1.99 1.05 9.75 0.85 1.29 0.20 51.42
Cs 0.14(0.05, 0.23) 0.01 1.06 3.87 16.99 0.00 78.09
Ba 2.93(2.87, 14.29) 0.58 14.29 1.31 0.76 0.00 69.89
Pb 0.08(0.12, 0.53) 0.02 1.99 1.98 3.56 0.00 176.52
Cd 0.09(0.09, 0.35) 0.00 1.29 2.05 3.79 0.00 118.14
As 0.27(0.24, 0.61) 0.00 1.70 1.51 1.51 0.00 108.24

Table 3

Correlation analysis of different elements in buckwheat"

元素
Element
Na Mg K Ca Fe Mn Cu Zn Se Ni Cr Co V Rb Sr Cs Ba Pb Cd As
Na 1
Mg 0.31 1
K 0.60** 0.48* 1
Ca 0.09 0.34 -0.03 1
Fe -0.11 0.03 0.17 -0.03 1
Mn 0.05 -0.03 0.13 -0.14 0.67** 1
Cu -0.21 0.14 -0.23 0.20 0.11 0.14 1
Zn 0.51** 0.27 0.15 0.19 0.12 0.24 -0.08 1
Se 0.58** -0.13 0.10 -0.20 -0.11 0.04 -0.11 0.39* 1
Ni 0.42* 0.18 0.29 0.17 -0.18 -0.33 -0.30 0.21 0.28 1
Cr 0.07 0.14 -0.04 0.17 -0.42* -0.20 -0.23 0.11 -0.11 0.34 1
Co -0.15 -0.10 0.10 0.13 0.47* 0.43* -0.06 0.18 -0.05 -0.27 -0.32 1
V -0.16 0.22 -0.04 0.19 -0.40* -0.30 -0.02 -0.12 -0.31 -0.02 0.42* -0.27 1
Rb 0.65** 0.21 0.26 0.05 -0.47* -0.39* -0.25 0.22 0.54** 0.60** 0.16 -0.26 0.05 1
Sr 0.10 0.22 -0.06 0.06 -0.30 -0.11 -0.06 0.13 -0.04 -0.06 0.43* -0.19 0.55** 0.20 1
Cs 0.13 -0.04 0.32 -0.17 -0.13 -0.29 -0.22 0.00 0.11 0.58** -0.08 -0.04 0.01 0.35 -0.23 1
Ba -0.15 0.24 0.21 -0.01 -0.15 -0.30 0.02 -0.13 -0.25 -0.01 0.10 -0.25 0.49** -0.03 0.41* 0.19 1
Pb -0.26 0.03 0.00 0.31 0.49** 0.19 -0.09 0.21 -0.21 0.02 0.01 0.76** -0.14 -0.32 -0.15 0.05 -0.17 1
Cd 0.01 0.47* 0.11 0.31 0.20 0.16 0.40* 0.33 -0.29 -0.38* -0.21 0.17 0.23 -0.35 0.26 -0.22 0.22 0.22 1
As -0.05 0.27 -0.13 0.25 0.23 0.32 0.39* 0.51** -0.02 -0.37 -0.08 0.43* 0.18 -0.29 0.27 -0.27 -0.07 0.47* 0.76** 1

Table 4

Difference analysis of mineral elements in buckwheat from different producing areas mg/kg"

元素
Element
吉林
Jilin
内蒙古东部
Eastern
Inner Mongolia
内蒙古西部
Western
Inner Mongolia
陕西
Shaanxi
甘肃
Gansu
四川
Sichuan
贵州
Guizhou
云南
Yunnan
Na 32.08±6.29f 169.48±10.43a 76.28±3.26d 61.82±22.91de 51.02±7.02ef 39.03±11.51ef 108.04±11.99c 145.23±22.20b
Mg 2054.64±219.72c 2274.96±24.09bc 2702.97±59.96a 2346.78±83.67b 2295.52±166.07b 2272.45±90.12bc 2419.67±101.76b 2307.16±59.44b
K 3686.75±1147.08cd 5233.55±133.97b 3433.51±77.75d 4634.96±203.06bc 4383.46±820.83bcd 4169.54±520.79bcd 5159.61±649.51b 6401.06±353.27a
Ca 64.98±7.27d 56.20±5.36d 76.73±15.39cd 95.40±8.66c 178.09±31.23a 135.60±4.74b 145.89±21.93b 144.73±10.61b
Fe 32.96±5.39b 26.93±1.91bc 22.08±2.57c 21.34±3.46c 26.01±5.34bc 29.90±0.33bc 43.67±4.52a 27.64±9.42bc
Mn 28.79±2.57c 27.55±2.82c 25.97±5.58cd 20.05±1.52d 47.65±5.58a 35.93±6.64b 35.92±4.03b 34.67±2.51b
Cu 14.31±11.87cd 6.76±0.47d 40.16±1.59b 7.14±0.34d 23.51±11.46c 15.11±2.25cd 53.45±7.81a 7.32±0.37d
Zn 17.32±3.35b 21.24±1.84b 16.41±4.19bc 18.10±3.05b 13.96±6.19c 18.49±3.79b 28.07±1.01a 18.13±3.51b
Se 0.06±0.02bc 0.17±0.02a 0.04±0.02bc 0.04±0.03bc 0.03±0.01c 0.04±0.01bc 0.03±0.02c 0.10±0.08b
Ni 4.61±0.69b 5.19±1.60b 4.98±0.86b 5.23±0.48b 11.01±1.07a 5.66±1.80b 4.64±0.41b 5.47±0.85b
Cr 0.51±0.05bc 0.58±0.29bc 0.84±0.11bc 1.11±0.16b 1.08±0.79b 2.13±0.04a 0.21±0.04c 0.94±0.38bc
Co 1.61±0.33a 0.33±0.05cd 0.42±0.32bcd 0.29±0.03d 0.50±0.25bcd 0.79±0.37b 0.71±0.18bc 0.51±0.11bcd
V 0.06±0.04a 0.03±0.03a 0.09±0.12a 0.31±0.44a 0.13±0.16a 0.13±0.18a 0.08±0.09a 0.08±0.09a
Rb 26.96±5.24bc
37.07±5.25a 25.06±8.12bc 23.60±5.23bc 15.27±5.93cd 11.28±2.21d 15.07±3.25cd 13.75±4.59d
Sr 3.25±0.62bc 3.25±0.81bc 4.07±1.84b 7.62±1.82a 1.28±0.29c 3.50±2.35bc 4.82±0.43b 3.14±0.67bc
Cs 0.05±0.03a 0.23±0.04a 0.12±0.08a 0.14±0.04a 0.33±0.51a 0.04±0.01a 0.05±0.02a 0.17±0.13a
Ba 2.19±1.35d 2.39±0.86d 2.84±1.14d 13.31±1.28a 7.03±3.37b 1.21±0.23d 5.61±0.92c 2.87±0.28d
Pb 0.05±0.03b 0.04±0.04b 0.12±0.16b 0.08±0.02b 0.37±0.48b 1.41±0.82a 1.05±0.26a 0.12±0.08b
Cd 0.15±0.18b 0.07±0.02b 0.15±0.19b 0.45±0.45b 0.05±0.06b 0.12±0.01b 0.92±0.34a 0.06±0.04b
As 0.03±0.04c 0.26±0.04b 0.31±0.20b 0.52±0.77ab 0.43±0.7ab 0.62±0.18ab 1.18±0.46a 0.16±0.07c

Table 5

Principal component analysis of mineral elements in buckwheat"

变量
Variable
主成分Principal component
PC1 PC2 PC3 PC4 PC5 PC6
Na -0.18 0.85 0.30 0.17 0.15 -0.14
Mg 0.19 0.02 0.39 0.01 -0.43 -0.59
K -0.09 0.49 0.29 0.56 0.36 0.10
Ca 0.16 -0.44 0.18 0.74 0.29 -0.11
Fe 0.63 0.33 -0.30 0.45 -0.15 0.26
Mn 0.33 0.23 -0.42 0.10 0.62 0.09
Cu 0.59 -0.16 0.15 0.19 -0.60 -0.19
Zn 0.67 0.63 0.08 0.02 -0.02 -0.06
Se -0.45 0.75 -0.01 0.06 -0.01 -0.08
Ni -0.45 -0.49 0.16 0.59 -0.03 0.01
Cr 0.08 -0.39 -0.09 -0.29 0.58 -0.52
Co 0.26 -0.02 -0.66 -0.09 -0.15 0.52
Rb -0.59 0.57 0.38 -0.13 -0.06 -0.08
Sr 0.28 0.14 0.58 -0.55 0.16 0.28
Ba -0.05 -0.37 0.71 0.10 -0.04 0.34
Pb 0.76 -0.07 -0.05 0.26 0.21 -0.28
Cd 0.73 0.09 0.46 0.04 -0.16 0.27
As 0.81 0.11 0.31 -0.04 0.19 -0.08
特征值Eigenvalue 5.25 3.16 2.43 2.01 1.54 1.14
方差贡献率Variance contribution rate (%) 26.27 15.80 12.14 10.05 7.72 5.70
累积方差贡献率Cumulative variance contribution rate (%) 26.27 42.06 54.20 64.25 71.98 77.67

Fig.1

PCA of mineral element content of buckwheat from different producing areas"

Fig.2

Fisher discriminant function of buckwheat from different producing areas"

Table 6

Validation results of stepwise discriminant analysis of buckwheat from different producing areas"

检验类型
Test type
产地
Producing area
预测组Prediction group 总数
Total
内蒙古东部
Eastern Inner
Mongolia
吉林
Jilin
内蒙古西部
Western
Inner Mongolia
甘肃
Gansu
陕西
Shaanxi
四川
Sichuan
云南
Yunnan
贵州
Guizhou
回代检验
Original test
内蒙古东部 10 0 0 0 0 0 0 0 10
吉林 0 8 0 0 0 0 0 0 8
内蒙古西部 0 0 10 0 0 0 0 0 10
甘肃 0 0 0 8 0 0 0 0 8
陕西 0 0 0 1 7 0 0 0 8
四川 0 0 0 0 0 5 0 0 5
云南 0 0 0 0 0 0 5 0 5
贵州 0 0 0 0 0 0 0 6 6
正确判别率 (%) 100.0 100.0 100.0 100.0 87.5 100.0 100.0 100.0 98.3
交叉验证
Cross validation
内蒙古东部 10 0 0 0 0 0 0 0 10
吉林 0 8 0 0 0 0 0 0 8
内蒙古西部 0 0 10 0 0 0 0 0 10
甘肃 0 0 0 7 1 0 0 0 8
陕西 0 0 0 0 8 0 0 0 8
四川 0 0 0 0 0 4 1 0 5
云南 0 0 0 0 0 1 3 1 5
贵州 0 0 0 0 0 0 0 6 6
正确判别率 (%) 100.0 100.0 100.0 87.5 100.0 80.0 60.0 100.0 93.3

Fig.3

Systematic cluster analysis of mineral elements in buckwheat from different producing areas"

[1] 任长忠, 赵钢. 中国荞麦学. 北京: 中国农业出版社, 2015.
[2] 任长忠, 崔林, 何峰, 等. 我国燕麦荞麦产业技术体系建设和发展. 吉林农业大学学报, 2018, 40(4):524-532.
[3] 张剑, 王前菲, 武垒垒, 等. 荞麦化学成分的研究进展. 西部中医药, 2020, 33(9):133-144.
[4] 黄凯丰, 李振宙, 王炎, 等. 我国荞麦高产栽培生理研究进展. 贵州师范大学学报(自然科学版), 2019, 37(1):119-124.
[5] 冯利芳, 郭军. 内蒙古荞麦和燕麦矿物质测定与分析. 食品研究与开发, 2020, 41(4):176-183.
[6] 章洁琼, 邹军, 卢扬, 等. 不同荞麦品种主要功能成分分析及评价. 种子, 2020(2):107-112.
[7] 王丽, 魏茂琼, 邵金良, 等. 荞麦类黄酮成分的含量测定与分析研究. 食品安全质量检测学报, 2018, 9(20):121-126.
[8] Hidalgo M J, Fechner D C, Marchevsky E J, et al. Determining the geographical origin of Sechium edule fruits by multielement analysis and advanced chemometric techniques. Food Chemistry, 2016, 210:228-234.
doi: 10.1016/j.foodchem.2016.04.120 pmid: 27211642
[9] 郑雷, 郭玉海. 不同种质肉苁蓉矿质元素分析. 光谱学与光谱分析, 2019, 39(12):3921-3924.
[10] 林立, 聂鲜钰, 陆春云, 等. 基于多糖和白及胶及矿质元素分析的白及种质资源特征研究. 中药材, 2019, 42(5):1000-1006.
[11] Zhang Q, Xu J G. Determining the geographical origin of common buckwheat from China by multivariate analysis based on mineral elements, amino acids and vitamins. Scientific Reports, 2017, 7(14):1-7.
doi: 10.1038/s41598-016-0028-x
[12] Zhang S S, Wei Y M, Wei S, et al. Authentication of Zhongning wolfberry with geographical indication by mineral profile. International Journal of Food Science and Technology, 2016, 52(2):457-463.
doi: 10.1111/ijfs.2017.52.issue-2
[13] He Y Y, Sun Q Q, Zhang X W, et al. Authentication of the geographical origin of Maca (Lepidium meyenii Walp.) at different regional scales using the stable isotope ratio and mineral elemental fingerprints. Food Chemistry, 2020, 311:1-8.
[14] Zhang J, Yang R D, Li Y C, et al. The role of soil mineral multi- elements in improving the geographical origin discrimination of tea (Camellia sinensis). Biological Trace Element Research, 2021, 199:4330-4341.
doi: 10.1007/s12011-020-02527-8 pmid: 33409909
[15] 中华人民共和国国家卫生和计划生育委员会. 食品安全国家标准:食品中钾、钠的测定:GB 5009. 91-2017. 北京: 中国标准出版社, 2017.
[16] 中华人民共和国国家卫生和计划生育委员会. 食品安全国家标准:食品中钙的测定:GB 5009. 92-2016. 北京: 中国标准出版社, 2016.
[17] 中华人民共和国国家卫生和计划生育委员会. 食品安全国家标准:食品中镁的测定:GB 5009. 241-2017 北京: 中国标准出版社, 2017.
[18] 中华人民共和国国家卫生和计划生育委员会. 食品安全国家标准:食品中多元素的测定:GB 5009. 268-2016. 北京: 中国标准出版社, 2016.
[19] 中华人民共和国国家卫生和计划生育委员会. 食品安全国家标准:食品中污染物限量GB 2762-2017. 北京: 中国标准出版社, 2017.
[20] 曹刚红. 葡萄酒的分离分析和产地识别研究. 深圳:深圳大学, 2019.
[21] 王晓慧. 线性判别分析与主成分分析及其相关研究评述. 中山大学研究生学刊(自然科学医学版), 2007(4):50-61.
[22] Hung A T, Leury B J, Sabin M A, et al. Nano chromium picolinate improves gene expression associated with insulin signaling in porcine skeletal muscle and adipose tissue. Animals, 2020, 10(9):1-14.
doi: 10.3390/ani10010001
[23] 崔胜先, 陈越. 微量元素钒在动物体内的生物学作用. 饲料与畜牧, 2000(6):13-17.
[24] 顾志荣. 当归多指标质量评价方法及其与土壤、海拔、经纬度和矿质元素的相关性研究. 兰州:甘肃中医药大学, 2015.
[25] 潘美娜. 不同光质对蓝莓幼苗矿质元素和光合作用的影响. 北京: 北京林业大学, 2018.
[26] Qian L L, Zhang C D, Zuo F, et al. Effects of fertilizers and pesticides on the mineral elements used for the geographical origin traceability of rice. Journal of Food Composition and Analysis, 2019, 83:103276-103283.
doi: 10.1016/j.jfca.2019.103276
[27] Zhao H Y, Tang J, Yang Q L. Effects of geographical origin, variety, harvest season, and their interactions on multi elements in cereal, tuber, and legume crops for authenticity. Journal of Food Composition and Analysis, 2021, 100:103900-103910.
doi: 10.1016/j.jfca.2021.103900
[28] Wang F, Zhao H Y, Yu C D, et al. Determination of the geographical origin of maize (Zea mays L.) using mineral element fingerprints. Journal of the Science of Food and Agriculture, 2019, 100(3):1294-1300.
doi: 10.1002/jsfa.v100.3
[1] Bai Kaihong, Abie Xiaobing, Xu Xiaoli, Jiang Na, Li Jianqiang, Luo Laixin. Analysis of Fungal Diversity in Seeds of Tartary Buckwheat from Liangshan, Sichuan Province [J]. Crops, 2023, 39(3): 260-266.
[2] Li Guangsheng, Lu Xiang, Lai Dili, Zhang Kaixuan, Wang Haihua, Zhou Meiliang. Molecular Cloning and Functional Analysis of Resistance Gene FtABCG12 of Tartary Buckwheat to Blight [J]. Crops, 2023, 39(3): 43-50.
[3] Wang Junzhen, Zhou Meiliang, Li Faliang, Zhang Kaixuan, Zhu Jianfeng, Shen A’yi, Luogu Youfu, Yao Juhong, Yin Yuanjie, Wu Dongming, Zhang Jie. Breeding and Cultivation Technology of New Tartary Buckwheat Variety “Chuanqiao 6” [J]. Crops, 2022, 38(6): 241-244.
[4] Hu Dan. Genetic Analysis of Culm Gravity Height and Snapping Resistance in Common Buckwheat [J]. Crops, 2022, 38(4): 83-89.
[5] Shi Xian, Li Hongyou, Lu Bingyue, Zhou Yun, Zhao Jiju, Zhao Mengli, Liang Jing, Meng Hengling. Physiological Responses of Three Tartary Buckwheat Varieties to Salt Stress and Evaluation of Salt Tolerance [J]. Crops, 2022, 38(3): 149-154.
[6] Yin Guifang, Duan Ying, Yang Xiaolin, Cai Suyun, Wang Yanqing, Lu Wenjie, Sun Daowang, He Runli, Wang Lihua. Cloning and Bioinformatics Analysis of FtC4H Gene from Tartary Buckwheat [J]. Crops, 2022, 38(1): 77-83.
[7] Cao Lixia, Zhou Haitao, Zhang Xinjun, Shi Bihong, Zhang Lixia, Li Yunxia, Liu Junxin, Bai Jing, Zhao Shifeng. Effects of Sowing Rates on Yield of Two Buckwheat Varieties in Northern Hebei [J]. Crops, 2021, 37(5): 140-145.
[8] Weng Wenfeng, Wu Xiaofang, Zhang Kaixuan, Tang Yu, Jiang Yan, Ruan Jingjun, Zhou Meiliang. The Overexpression of FtbZIP5 Improves Accumulation of Flavonoid in the Hairy Roots of Tartary Buckwheat and Its Salt Tolerance [J]. Crops, 2021, 37(4): 1-9.
[9] Jia Ruiling, Zhao Xiaoqin, Nan Ming, Chen Fu, Liu Yanming, Wei Liping, Liu Junxiu, Ma Ning. Genetic Diversity Analysis and Comprehensive Assessment of Agronomic Traits of 64 Tartary Buckwheat Germplasms [J]. Crops, 2021, 37(3): 19-27.
[10] Yang Chongqing, Chang Keqin, Mu Lanhai, Du Yanping, Zhang Jiupan, Li Yaodong, Zhang Xiaojuan. Status and Trend Analysis of Buckwheat Variety Improvement and Industrial Development [J]. Crops, 2021, 37(2): 28-34.
[11] Jin Jiangang, Tian Zaifang. Grey Correlation Analysis of Introduced Tartary Buckwheat in the Northern Shanxi [J]. Crops, 2021, 37(2): 52-56.
[12] Ma Mingchuan, Liu Longlong, Liu Zhang, Zhou Jianping, Nan Chenghu, Zhang Lijun. Analysis of SSR Loci in Whole Genome and Development of Molecular Markers in Tartary Buckwheat [J]. Crops, 2021, 37(1): 38-46.
[13] Lu Xiaoling, He Ming, Zhang Kaixuan, Liao Zhiyong, Zhou Meiliang. Study on the Cloning and Transformation of Rhamnose Transferase FtF3GT1 Gene in Tartary Buckwheat [J]. Crops, 2020, 36(5): 33-40.
[14] Yang Xuele, Zhang Lu, Li Zhiqing, He Luqiu. Diversity Analysis of Tartary Buckwheat Germplasms Based on Phenotypic Traits [J]. Crops, 2020, 36(5): 53-58.
[15] Cao Changlin, Lü Huiqing, Hao Zhiping, Gao Xiang, Zhou Zhongyu. Effects of Foliar Spraying Zinc and Boron Fertilizer on the Yield and Quality of Jin Buckwheat (Bitter) No.5 [J]. Crops, 2020, 36(4): 135-142.
Viewed
Full text


Abstract

Cited

  Shared   
  Discussed   
No Suggested Reading articles found!