



小麦是当今世界最重要的粮食作物之一,而我国是小麦最大的生产国和消费国,对优质小麦的需求日益旺盛,但受产区内品种混杂、区域生态条件影响,不同区域间小麦品质差异显著[1]。与普通中筋小麦相比,由于碳氮代谢的相互联系,一些优质小麦品质和产量协同性差,因此我国小麦产业亟需在兼顾产量的前提下全方位提高品质[2-
近年来,河北省审定的高产优质小麦品种繁多,但其在不同生态点的适应性与稳定性有待进一步验证[19]。为此,本研究以筛选出兼具高产、优质及适应性强的优良基因型品种为目标,以22个高产优质的品种(系)为材料,在黄淮海北部河北省的2个试点进行试验,以探究不同类型品种(系)产质协调性及相应生理指标差异,旨在为该地区优质小麦生产的品种选择提供理论依据。
1 材料与方法
1.1 试验地概况与试验材料
2023-2024年在河北省石家庄市藁城区赵县(ZX)宏瑞种业强筋麦研发基地(37.86° N,114.79° E)和沧州市吴桥县(WQ)中国农业大学实验站(37.69° N,116.62° E)进行试验,其中藁城区作为石家庄市强筋麦传统种植区,强筋麦种植覆盖率高达90%,而吴桥县是小麦节水高产技术体系集成与示范的典型区域。2023-2024年赵县和吴桥县冬小麦生长季≥0 ℃积温分别为2191.7和2251.5 ℃;生育期总降水量分别为154.30和154.50 mm(数据来源于吴桥实验站气象站及河北宏瑞种业赵县强筋麦研发基地设立的气象监测点)。具体的降水分布和气温见图1。赵县试验田播种前0~20 cm土层的土壤中含有机质18.39 g/kg、全氮1.15 g/kg、速效磷20.22 mg/kg、速效钾162.51 mg/kg;吴桥试验田的0~20 cm表层土壤含有机质11.2 g/kg、全氮0.98 g/kg、速效磷25.3 mg/kg、速效钾106.2 mg/kg。供试材料为黄淮海平原北片当前推广及新育成的22个小麦品种(系)(表1)。
图1
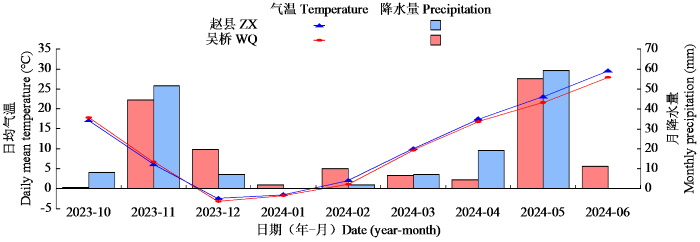
图1
2023-2024年2个试点冬小麦生长季降水量和温度
Fig.1
Precipitation and temperature during the winter wheat growing season in the two experimental sites from 2023 to 2024
表1 参试小麦品种(系)
Table 1
| 强筋Strong gluten | 中强筋Medium-strong gluten | ||||||||
|---|---|---|---|---|---|---|---|---|---|
| 编号 Code | 品种 Variety (line) | 审定编号 Registration number | 编号 Code | 品种 Variety | 审定编号 Registration number | 编号 Code | 品种 Variety | 审定编号 Registration number | |
| JMU87 | 冀麦U87 | 冀审麦20210023 | SM22 | 石麦22 | 冀审麦2013002 | HM36 | 衡麦36 | 国审麦20230181 | |
| LM-01 | LM-01 | 鲁审麦20206032 | SN086 | 石农086 | 冀审麦20198017 | HM30 | 衡麦30 | 冀审麦20219002 | |
| JM5022 | 济麦5022 | 鲁审麦20210015 | H4399 | 衡4399 | 冀审麦2008002 | DH206 | 登海206 | 国审麦20190038 | |
| ZM578 | 中麦578 | 国审麦20210059 | JIM418 | 冀麦418 | 国审麦2016026 | ND171 | 农大171 | 冀审麦20239003 | |
| GY5218 | 藁优5218 | 冀审麦2015005 | LX103 | 轮选103 | 冀审麦20198022 | ||||
| ZM886 | 中麦886 | 冀审麦20240025 | JM4072 | 济麦4072 | 国审麦20190057 | ||||
| JMU80 | 冀麦U80 | 国审麦20210054 | G35 | 衡观35 | 国审麦2006010 | ||||
| SN44 | 山农44 | 鲁审麦20210016 | HM33 | 衡麦33 | 国审麦20230180 | ||||
| JM221001 | 济麦221001 | 未通过审定 | SN66 | 山农66 | 鲁审麦20230031 | ||||
1.2 试验设计
采用随机区组设计,2个试验点每个品种(系)小区面积为30 m2,于2023年10月21日用小区播种机条播,吴桥和赵县试验点分别于2024年6月6日和6月10日收获,底肥为复合肥(15-15-15)750 kg/hm2、44.8 kg P2O5/hm2(磷酸二铵,46%)和51.7 kg N/hm2(尿素,46%),播前灌底墒水,灌溉量为750 m3/hm2,之后的灌溉方式、灌溉量及处理日期如表2所示,其余田间管理按照当地高产麦田的标准进行。
表2 各试点生育期的灌溉量
Table 2
| 试点 Location | 灌溉方式 Irrigation method | 灌溉时期 Irrigation period | 灌溉日期 Irrigation date | 灌溉量 Irrigation (m3/hm2) |
|---|---|---|---|---|
| 吴桥WQ | 传统畦灌 | 拔节期 | 4月4日 | 750 |
| 开花期 | 5月4日 | 750 | ||
| 赵县ZX | 微喷灌 | 拔节期 | 4月3日 | 600 |
| 开花期 | 5月1日 | 600 |
1.3 测定项目与方法
1.3.1 生理指标
于2023-2024年小麦开花期、灌浆前期和灌浆后期每个小区取10个单茎,使用SPAD-502叶绿素测定仪(Spectrum technologies,美国)测量旗叶SPAD值,每片叶从基部到顶端(避开叶脉)测3点取均值,每个小区重复3次;使用GreenSeeker便携式光谱仪(Trimble,美国)测定植被归一化指数(NDVI),每个小区重复3次。
1.3.2 产量及其构成因素
在收获前,每个小区随机选取60个穗,考察穗粒数,重复3次。收获期每个小区随机选取3 m2考察穗数,重复3次,然后脱粒测定实际产量。使用PM-8188 NEW(Kett,日本)籽粒水分测定仪测定籽粒含水量,统一折算13%含水量的籽粒,每个样品随机选取1000粒测量千粒重,3次重复。籽粒后熟后进行品质分析。
1.3.3 蛋白质含量
小麦籽粒烘干后磨粉,采用半微量凯氏定氮法测定籽粒氮含量。取0.25 g粉样,2.50 g催化剂(硫酸钾:无水硫酸铜:硒粉=100:10: 1)加入消煮管,再加入5 mL浓硫酸,置于石墨消解炉中消煮1 h。取出后放凉至亮绿色,配制相应2%硼酸吸收液、40%碱液(NaOH溶液)、0.05 mol/L标准酸和指示剂,采用Hanon K9860测定样品的耗酸体积。每次试验开始前测定3个空白和回收率,并依此计算含氮量,利用蛋白质系数6.25计算蛋白质含量。
1.3.4 品质指标
在成熟期,每个小区收割3 m2的小麦,3次重复,脱粒和清选后放在储存桶中3个月。从每个重复中随机选取2 kg籽粒,在用Quadrumat junior磨粉机(Brabender,德国)磨粉之前,将样品含水量调整到14%(润麦)。参照程序AACC 38-12.02(AACC,2004),用Glutomatic 2200面筋洗涤主机(Perten,瑞典)测定面粉的湿面筋含量(WGC)。参照AACC方法54-21(AACC,2000),用Farinograph-AT全自动粉质仪(Brabender,德国)测定面团形成时间(DDT)和面团稳定时间(DST)。参照AACC方法54-10(AACC,2000),使用Extensograph-E面团拉伸仪(Brabender,德国)测定拉伸面积和最大拉伸阻力。
1.3.5 无人机数据
选取的无人机遥感指标为宽波段植被指数,其构建基于植物冠层特有的光谱反射特性。这些指数通过量化特定波段的反射率组合,能够有效反演作物的生理参数[20]。
无人机航拍与田间农艺性状调查同步进行。为获取高质量的遥感影像,飞行作业安排在气象条件稳定、光照充足的时间段(每日10:00-14:00)实施。本试验选用大疆精灵4多光谱版无人机平台,其集成的高精度多光谱成像系统具体参数见表3。
表3 多光谱相机相关参数
Table 3
| 指标Index | 参数Parameter |
|---|---|
| 影像传感器Image sensor | 6个1/2.9英寸CMOS,包括1个用于可见光成像的彩色传感器和5个用于多光谱成像的单色传感器,单个传感器有效像素208万(总像素212万) |
| 滤光片Filter | 蓝(B):450 nm±16 nm; |
| 绿(G):560 nm±16 nm; | |
| 红(R):650 nm±16 nm; | |
| 红边(RE):730 nm±16 nm; | |
| 近红外(NIR):840 nm±26 nm | |
| 镜头Lens | FOV:62.7°;焦距:5.74 mm(35 mm格式等效:40 mm)无穷远固定焦距;光圈:f/2.2 |
| 彩色传感器ISO范围Color sensor ISO range | 200~800 |
| 单色传感器增益Monochrome sensor gain | 1~8倍 |
| 电子全局快门Electronic global shutter | 1/100~1/20 000 s(可见光成像);1/100~1/10 000 s(多光谱成像) |
| 照片最大分辨率Maximum photo resolution | 1600×1300(4.00:3.25) |
| 照片格式Photo format | JPEG(可见光成像)+TIFF(多光谱成像) |
用DJI GS PRO软件规划自动飞行航线。关键飞行参数设置为:相对高度30 m,传感器垂直向下(云台俯仰角-90°),航向与旁向重叠率分别设定为90%和80%,以确保影像拼接的精度。为进行精确的地理配准,在试验区内均匀布设8个地面控制点(GCP),并采用D-RTK2高精度GNSS移动站采集各控制点的厘米级坐标。
原始多光谱影像通过Pix4D mapper软件进行处理。处理流程包括:选择农业多光谱处理模板,导入飞行前拍摄的参考白板图像进行辐射校正,并加载地面控制点坐标文件以完成几何精校正与正射影像图生成。最终输出包含蓝、绿、红、红边和近红外5个波段的GeoTIFF格式正射影像。将生成的5波段正射影像导入QGIS地理信息系统平台,运用栅格计算器功能,依据表4中的公式计算各植被指数,相关植被指数及其计算公式参照前人[21]研究。为进一步消除土壤背景值对植被指数估算的干扰,采用OTSU自动阈值分割算法区分植被与非植被像元,进而基于试验小区边界矢量文件,精确提取各小区在不同生育时期的植被指数均值[22],每个小区3次重复。
表4 无人机宽波段植被指数计算公式
Table 4
| 植被指数Vegetation index | 计算公式Calculation formula |
|---|---|
| REV-BLUE | BLUE |
| REV-GREEN | GREEN |
| REV-RED | RED |
| REV-RE | REDEDGE |
| REV-NIR | NIR |
| EVI | 2.5(NIR-RED)/(1+NIR-2.4RED) |
| NRI | (GREEN-RED)/(GREEN+RED) |
| OSAVI | 1.6[(NIR-RED)/(NIR+RED+0.16)] |
| TCARI | 3[(REDEDGE-RED)-0.2(REDEDGE-GREEN)(REDEDGE/RED)] |
1.4 数据处理
使用Excel 2010整理数据,使用SPSS 20.0软件统计分析,包括使用独立样本t检验进行品种间和生态区间的显著性检验,使用一般线性模型中的单因素方差分析程序进行交互作用和系统聚类分析,对Z-score标准化后的蛋白质含量与产量进行分析。采用Origin 2021软件作图。使用R 4.1.1进行GGE分析与作图。
2 结果与分析
2.1 参试小麦品种(系)产量及其构成因素
表5 参试品种(系)产量及其构成因素
Table 5
| 小麦类型 Wheat type | 平均产量排名 Average yield ranking | 编号 Code | 产量 Yield (kg/hm2) | 穗数 Spike number (×104/hm2) | 穗粒数 Grains per spike | 千粒重 1000-grain weight (g) | |||||||||
|---|---|---|---|---|---|---|---|---|---|---|---|---|---|---|---|
| 吴桥 WQ | 赵县 ZX | 吴桥 WQ | 赵县 ZX | 吴桥 WQ | 赵县 ZX | 吴桥 WQ | 赵县 ZX | ||||||||
| 中强筋小麦 Medium-strong gluten wheat | 1 | HM30 | 8035.23 | 8857.81 | 756.15 | 635.50 | 36.67 | 33.76 | 40.77 | 45.60 | |||||
| 2 | SN086 | 8251.74 | 8500.34 | 720.45 | 522.48 | 36.67 | 35.21 | 41.40 | 42.62 | ||||||
| 3 | H4399 | 7414.99 | 9261.90 | 693.15 | 742.96 | 38.87 | 35.33 | 35.33 | 37.70 | ||||||
| 4 | DH206 | 7488.78 | 9135.03 | 833.70 | 561.39 | 38.02 | 35.36 | 41.87 | 41.07 | ||||||
| 5 | HM36 | 8143.34 | 8175.31 | 664.35 | 587.33 | 37.97 | 34.12 | 38.98 | 45.20 | ||||||
| 6 | LX103 | 7619.30 | 8691.34 | 699.00 | 442.81 | 41.33 | 32.45 | 38.87 | 40.03 | ||||||
| 7 | G35 | 7804.72 | 8408.24 | 648.90 | 544.71 | 41.90 | 43.08 | 41.35 | 41.28 | ||||||
| 8 | HM33 | 8064.46 | 8064.94 | 672.30 | 731.84 | 40.10 | 33.65 | 38.25 | 40.98 | ||||||
| 9 | SM22 | 7702.91 | 8425.96 | 659.55 | 715.17 | 41.33 | 34.23 | 39.77 | 36.56 | ||||||
| 10 | SN66 | 7752.81 | 7823.78 | 625.31 | 542.86 | 41.65 | 35.12 | 38.94 | 37.53 | ||||||
| 11 | JM4072 | 7749.22 | 7615.03 | 585.84 | 442.81 | 39.27 | 33.62 | 43.45 | 39.96 | ||||||
| 12 | JM418 | 6266.84 | 8359.36 | 701.70 | 531.74 | 36.00 | 35.60 | 40.27 | 38.22 | ||||||
| 13 | ND171 | 7019.22 | 7191.72 | 627.15 | 629.94 | 38.70 | 34.50 | 31.98 | 35.50 | ||||||
| 平均值Mean | 7639.50 | 8346.98 | 683.66 | 587.05 | 39.11 | 35.08 | 39.32 | 40.17 | |||||||
| 变异系数CV (%) | 8.80 | 10.08 | 9.24 | 21.48 | 6.42 | 11.08 | 7.45 | 7.65 | |||||||
| 方差分析Analysis of variance | ** | ** | ** | ** | ** | ** | ** | ** | |||||||
| 强筋小麦 Strong gluten wheat | 1 | ZM578 | 8808.62 | 8337.98 | 685.45 | 535.45 | 37.05 | 32.23 | 47.38 | 46.92 | |||||
| 2 | JM221001 | 8437.55 | 8098.60 | 488.47 | 261.23 | 45.22 | 39.33 | 53.78 | 47.67 | ||||||
| 3 | GY5218 | 7643.49 | 8329.43 | 742.03 | 570.65 | 31.50 | 37.42 | 34.70 | 36.44 | ||||||
| 4 | JMU80 | 8138.11 | 7739.45 | 696.35 | 424.29 | 38.63 | 32.85 | 42.43 | 41.82 | ||||||
| 5 | JM5022 | 8239.64 | 7585.58 | 440.44 | 337.21 | 55.07 | 46.83 | 41.64 | 40.33 | ||||||
| 6 | ZM886 | 7905.18 | 7322.57 | 670.66 | 687.38 | 34.00 | 33.37 | 41.43 | 42.86 | ||||||
| 7 | JMU87 | 7191.03 | 7922.68 | 727.36 | 381.67 | 36.85 | 34.28 | 39.49 | 41.97 | ||||||
| 8 | SN44 | 7416.71 | 7476.70 | 834.08 | 455.78 | 32.07 | 30.37 | 36.23 | 34.78 | ||||||
| 9 | LM-01 | 6975.34 | 7726.05 | 589.29 | 468.75 | 39.47 | 36.80 | 43.54 | 43.68 | ||||||
| 平均值Mean | 7861.74 | 7837.67 | 652.68 | 458.04 | 38.87 | 35.94 | 42.29 | 41.83 | |||||||
| 变异系数CV (%) | 8.61 | 6.62 | 19.26 | 29.45 | 19.37 | 15.30 | 13.17 | 9.93 | |||||||
| 方差分析Analysis of variance | ** | ** | ** | ** | ** | ** | ** | ** | |||||||
“**”表示在P < 0.01水平上差异显著。
“**”indicates significant difference at P < 0.01 level.
图2
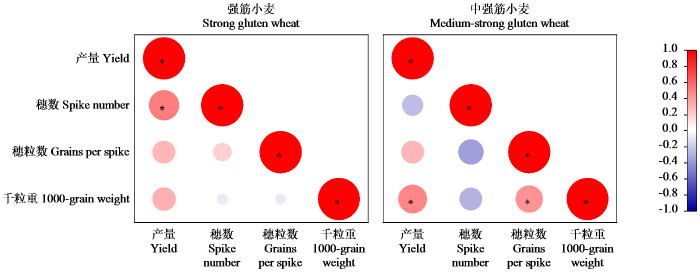
图2
强筋和中强筋小麦品种(系)产量与其构成因素的相关分析热图
“*”表示在P < 0.05水平上差异显著。
Fig.2
Heat map of correlation analysis among yield and its components of strong gluten and medium-strong gluten wheat varieties (line)
“*”indicates significant difference at P < 0.05 level.
2.2 参试小麦品种(系)基因型与环境互作分析
2.2.1 参试小麦品种(系)的生态适应性分析
图3
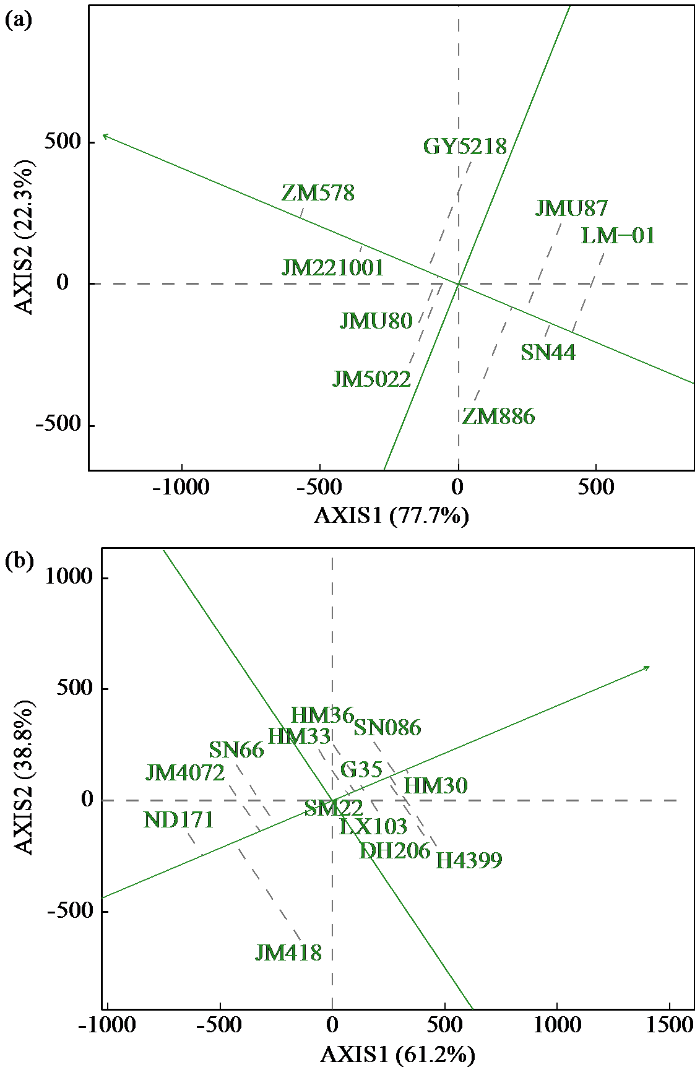
图3
参试小麦GGE双标图的丰产性与稳产性功能分析
Fig.3
Functional analysis of high and stable yield of tested wheat varieties (line ) based on GGE biplot
GGE双标图的“丰产性与稳产性”功能图可综合评估小麦区域试验品种的丰产性和稳定性,带箭头的直线为平均环境轴,品种(系)越靠近平均环境轴箭头的正方向代表丰产性越好,反之则越差;品种(系)的稳定性由其对应点向平均环境轴所作垂线的长度来表征,垂线越短表明该品种在不同环境中的产量波动越小,稳产性则越好。强筋小麦中,中麦578、济麦221001、藁优5218、冀麦U80和济麦5022的产量超过了平均水平,表现出丰产性;在稳产性方面,中麦578和济麦221001稳产性最好,藁优5218、中麦886和济麦5022稳定性弱;中强筋小麦中,衡麦30、石农086、衡麦36、衡麦33、衡观35、石麦22、轮选103、登海206和衡4399在产量表现上高于平均水平,展现出丰产性;就稳产性而言,衡麦30、衡观35和石麦22表现最佳,而冀麦418、衡4399和登海206的稳定性差。
2.2.2 参试小麦品种(系)的综合表现
图4
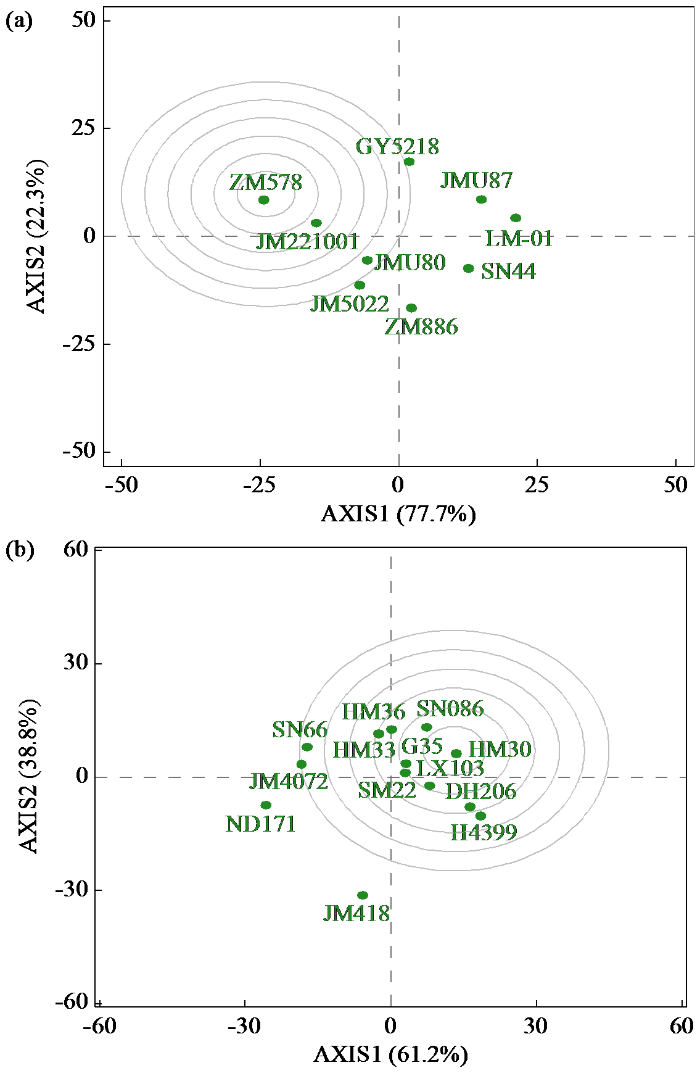
图4
参试小麦GGE双标图的理想品种(系)功能分析
Fig.4
Analysis of the ideal varieties (line) function of tested wheats based on GGE biplot
2.3 参试小麦品种(系)蛋白质含量
根据表6可知,强筋小麦的平均蛋白质含量显著高于中强筋小麦,其中强筋小麦在吴桥的蛋白质含量低于赵县,且中强筋小麦在2个试点的平均值差值较小。
表6 参试小麦品种(系)蛋白质含量
Table 6
| 小麦类型 Wheat type | 排名 Ranking | 编号 Code | 蛋白质含量Protein content | ||
|---|---|---|---|---|---|
| 吴桥WQ | 赵县ZX | 平均值Mean | |||
| 强筋小麦 Strong gluten wheat | 1 | JMU87 | 15.66 | 14.70 | 15.19 |
| 2 | ZM886 | 15.39 | 14.91 | 15.15 | |
| 3 | SN44 | 14.86 | 15.28 | 15.07 | |
| 4 | JM221001 | 14.84 | 14.86 | 14.85 | |
| 5 | LM-01 | 13.92 | 15.37 | 14.64 | |
| 6 | GY5218 | 14.61 | 14.45 | 14.53 | |
| 7 | ZM578 | 14.61 | 14.21 | 14.41 | |
| 8 | JM5022 | 14.00 | 14.44 | 14.22 | |
| 9 | JMU80 | 13.91 | 14.21 | 14.06 | |
| 平均值 | 14.65 | 14.71 | 14.68 | ||
| 中强筋小麦 Medium- strong gluten wheat | 1 | ND171 | 14.93 | 15.03 | 14.98 |
| 2 | SN66 | 14.36 | 14.56 | 14.46 | |
| 3 | JM4072 | 14.39 | 14.25 | 14.32 | |
| 4 | HM36 | 14.18 | 14.14 | 14.16 | |
| 5 | DH206 | 14.19 | 14.11 | 14.15 | |
| 6 | H4399 | 13.84 | 14.31 | 14.07 | |
| 7 | SN086 | 14.02 | 14.04 | 14.03 | |
| 8 | HM30 | 13.92 | 14.12 | 14.02 | |
| 9 | G35 | 14.01 | 13.97 | 13.99 | |
| 10 | LX103 | 14.05 | 13.78 | 13.91 | |
| 11 | HM33 | 13.99 | 13.83 | 13.91 | |
| 12 | SM22 | 14.03 | 13.69 | 13.86 | |
| 13 | JM418 | 13.76 | 13.61 | 13.69 | |
| 平均值 | 14.13 | 14.11 | 14.12 | ||
强筋小麦品种(系)中JMU87总平均蛋白质含量最高,且在2个试点均保持高水平,ZM886和SN44在2个试点的含量非常接近,显示出强稳定性,而LM-01呈现出地点间变异,其在赵县的蛋白质含量显著高于吴桥,2个试点相差大于1%;中强筋小麦中ND171总平均蛋白质含量最高,而JM418和SM22的平均蛋白质含量最低,从稳定性看,JM4072、HM36和DH206在2个试点间的蛋白质含量差距小,且组内标准差小,表现出强稳定性,相较之下,H4399、LX103和SM22在2个试点间的蛋白质含量差值大,稳定性差。
2.4 不同小麦品种(系)产量和蛋白质含量的聚类分析
图5
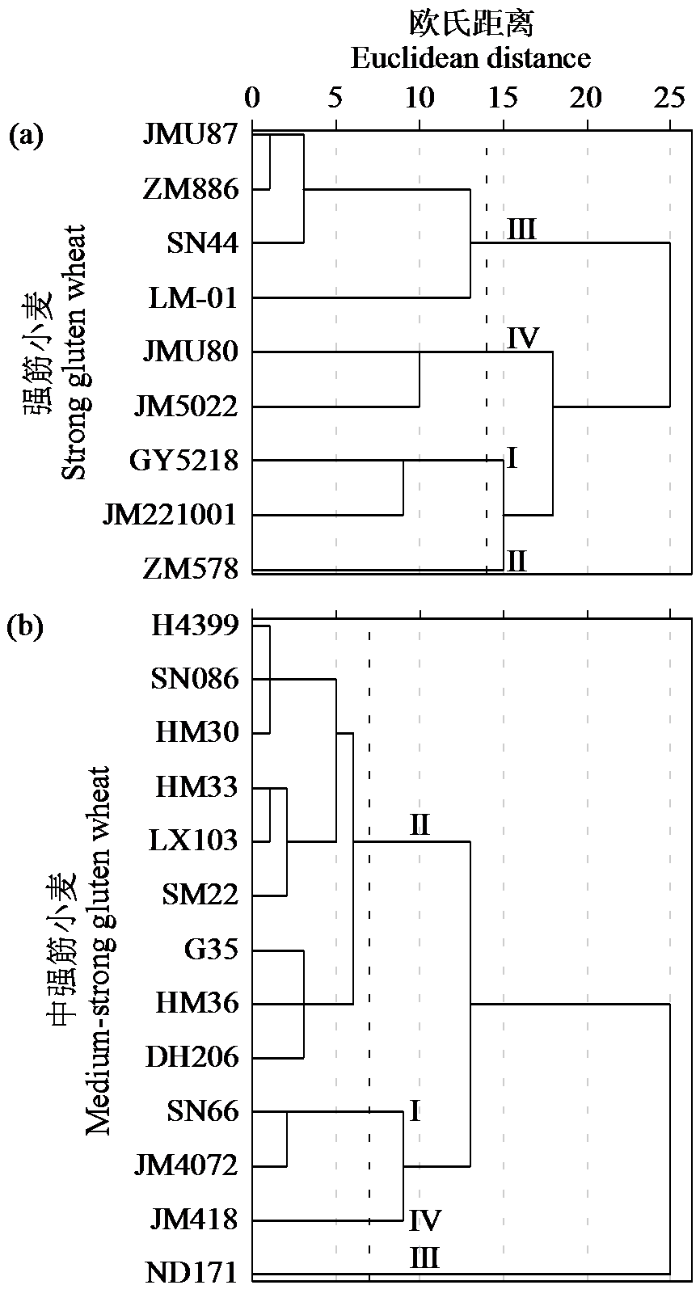
图5
参试小麦产量与蛋白质含量聚类
Fig.5
Clustering of yield and protein content of tested wheats
参试小麦的产量及蛋白质含量数据详见表7。强筋小麦品种(系)中筛选出4个类型:第I类为高产优质型,包括藁优5218和济麦221001,其平均产量和蛋白质含量分别达到8127.27 kg/hm2与14.69%;第Ⅱ类为高产型,仅包含中麦578,产量达8573.30 kg/hm2,蛋白质含量为14.41%;第Ⅲ类为优质型,包括冀麦U87、中麦886、山农44和LM-01共4个品种,平均蛋白质含量为15.01%,而平均产量为7492.03 kg/hm2;第Ⅳ类则为均衡型,包括冀麦U80和济麦5022,平均产量与蛋白质含量分别为7925.69 kg/hm2和14.14%。
表7 参试小麦品种(系)的产量和蛋白质含量
Table 7
| 类型 Type | 强筋小麦 Strong gluten wheat | 中强筋小麦 Medium-strong gluten wheat | ||
|---|---|---|---|---|
| 平均产量 Average yield (kg/hm2) | 平均蛋白质含量 Average protein content (%) | 平均产量 Average yield (kg/hm2) | 平均蛋白质含量 Average protein content (%) | |
| I | 8127.27b | 14.69ab | 7735.21b | 14.39b |
| Ⅱ | 8573.30a | 14.41ab | 8224.80a | 14.01bc |
| III | 7492.03c | 15.01a | 7105.47c | 14.98a |
| IV | 7925.69b | 14.14b | 7313.10bc | 13.69c |
不同小写字母表示在P < 0.05水平上差异显著。下同。
Different lowercase letters indicate significant differences at P < 0.05 level. The same below.
中强筋小麦品种(系)中筛选出4个类型:第I类为高产优质型,包括山农66和济麦4072,其平均产量达7735.21 kg/hm2,平均蛋白质含量为14.39%;第Ⅱ类为高产型,包括衡4399、石农086、衡麦30、衡麦33、轮选103、石麦22、衡观35、衡麦36和登海206共9个品种,该类平均产量最高,达8224.80 kg/hm2,但平均蛋白质含量为14.01%;第Ⅲ类为优质型,仅包括农大171,平均蛋白质含量表现最高,为14.98%;第Ⅳ类为均衡型,仅包括冀麦418,平均产量为7313.10 kg/hm2,平均蛋白质含量为13.69%。
表8 高产优质小麦品种(系)的品质指标
Table 8
| 类型 Type | 品种(系) Variety (line) | 蛋白质含量 Protein content (%) | 面团形成时间 Dough development time (min) | 面团稳定时间 Dough stability time (min) | |||||
|---|---|---|---|---|---|---|---|---|---|
| 吴桥WQ | 赵县ZX | 吴桥WQ | 赵县ZX | 吴桥WQ | 赵县ZX | ||||
| 强筋Strong gluten | 济麦221001 | 14.73±0.23 | 14.29±1.62 | 5.77±0.36 | 5.34±0.33 | 15.97±1.06 | 16.64±1.81 | ||
| 藁优5218 | 15.07±0.45 | 14.66±0.39 | 2.37±0.31 | 3.10±0.18 | 12.64±0.38 | 13.70±0.20 | |||
| 中强筋Medium-strong gluten | 山农66 | 14.38±0.44 | 13.74±0.12 | 2.91±0.90 | 2.81±0.17 | 9.15±0.93 | 9.98±1.07 | ||
| 济麦4072 | 13.96±0.37 | 14.02±0.26 | 1.87±0.33 | 1.90±0.21 | 12.10±1.71 | 11.62±0.90 | |||
表9 高产优质小麦品种(系)的品质性状
Table 9
| 类型 Type | 品种(系) Variety (line) | 湿面筋含量 Wet gluten content (%) | 面团拉伸面积 Dough extension area (cm2) | 面团最大拉伸阻力 Dough maximum resistance (E.U.) | |||||
|---|---|---|---|---|---|---|---|---|---|
| 吴桥WQ | 赵县ZX | 吴桥WQ | 赵县ZX | 吴桥WQ | 赵县ZX | ||||
| 强筋Strong gluten | 济麦221001 | 30.9±1.0 | 31.3±2.6 | 100.07±3.76 | 91.87±1.47 | 485.54±13.44 | 415.22±4.91 | ||
| 藁优5218 | 31.9±3.8 | 32.3±1.4 | 116.30±5.75 | 105.50±3.56 | 669.47±2.84 | 617.79±4.26 | |||
| 中强筋Medium-strong gluten | 山农66 | 29.9±1.1 | 30.2±0.6 | 97.17±4.26 | 98.71±2.00 | 539.74±13.21 | 504.52±8.87 | ||
| 济麦4072 | 28.8±1.4 | 29.3±0.9 | 100.30±7.75 | 109.90±4.57 | 455.53±9.74 | 430.53±9.02 | |||
在面团流变学特性方面,强筋品种表现出显著优势。济麦221001的面团形成时间最长,稳定时间最高,符合强筋小麦标准(>8 min)。藁优5218的面团拉伸面积和面团最大拉伸阻力均显著高于其他品种,表明其面筋网络结构稳定,延展性和弹性俱佳。相比之下,中强筋品种山农66和济麦4072的面团稳定时间和面团拉伸阻力虽低于强筋品种,但仍达到中强筋水平。
试点间比较显示,赵县试点的济麦221001在蛋白质含量和稳定时间上优于吴桥试点,而藁优5218在吴桥试点的拉伸阻力表现更佳,表明环境因素对部分品质指标有一定影响。综上,济麦221001和藁优5218在蛋白质含量、湿面筋含量及面团流变学特性上均表现优异,符合优质强筋小麦标准,适合高筋粉加工;而山农66和济麦4072的品质指标达到中强筋水平,可用于中高档面制品生产。
赵县试点的强筋品种济麦221001和藁优5218的蛋白质含量较吴桥试点低0.4%~0.5%,但稳定时间更长,表明赵县环境可能更利于面筋质量发育而非蛋白质积累。强筋品种在吴桥表现出更强的拉伸阻力即面筋强度,而赵县更利于稳定时间延长,说明环境对品质的影响具有指标特异性。中强筋品种受环境影响小,可能因其遗传背景更适应广泛生态条件。
2.5 不同类型品种(系)的SPAD值及NDVI值
由表10可知,Ⅰ和Ⅱ类小麦开花期的NDVI值显著高于Ⅳ类;灌浆前期,Ⅱ类显著高于Ⅰ与Ⅲ类,Ⅳ类仍为最低;灌浆后期Ⅳ类显著低于其他类型。各类型旗叶SPAD值均在开花期达到最高,灌浆后期Ⅳ类的SPAD值显著高于高产型,与其他2个类型无显著差异。
表10 强筋小麦品种(系)不同类型的SPAD值及NDVI值
Table 10
| 品种(系)类型 Variety (line) type | 归一化植被指数NDVI | SPAD值SPAD value | |||||
|---|---|---|---|---|---|---|---|
| 开花期 Anthesis stage | 灌浆前期 Early filling stage | 灌浆后期 Later filling stage | 开花期 Anthesis stage | 灌浆前期 Early filling stage | 灌浆后期 Later filling stage | ||
| Ⅰ | 0.83a | 0.81b | 0.77a | 56.9a | 54.8a | 51.0ab | |
| Ⅱ | 0.84a | 0.84a | 0.76a | 60.4a | 56.5a | 49.4b | |
| Ⅲ | 0.81ab | 0.81b | 0.75a | 56.7a | 54.4a | 50.4ab | |
| Ⅳ | 0.77b | 0.76c | 0.71b | 57.8a | 55.6a | 53.1a | |
由表11可知,在中强筋小麦中,Ⅳ类的NDVI值显著高于Ⅰ和Ⅲ类;灌浆前期则为Ⅱ类显著高于Ⅳ类,与其他2种类型无显著差异。对于SPAD值而言,Ⅱ类从开花至灌浆后期始终高于其他类别,且在灌浆后期与其他类型存在显著差异。
表11 中强筋小麦品种不同类型的SPAD值及NDVI值
Table 11
| 品种类型 Variety type | 归一化植被指数NDVI | SPAD值SPAD value | |||||
|---|---|---|---|---|---|---|---|
| 开花期 Anthesis stage | 灌浆前期 Early filling stage | 灌浆后期 Later filling stage | 开花期 Anthesis stage | 灌浆前期 Early filling stage | 灌浆后期 Later filling stage | ||
| Ⅰ | 0.82b | 0.82ab | 0.78a | 55.6a | 55.7a | 53.7b | |
| Ⅱ | 0.84ab | 0.84a | 0.77a | 57.9a | 56.0a | 55.1a | |
| Ⅲ | 0.82b | 0.82ab | 0.78a | 57.1a | 54.8a | 53.8b | |
| Ⅳ | 0.86a | 0.79b | 0.77a | 56.6a | 54.5a | 52.4b | |
2.6 不同类型品种(系)无人机植被指数特征
表12 强筋小麦不同类型的植被指数
Table 12
| 植被指数 Vegetation index | 生育时期 Growing stage | 品种(系)类型Variety (line) type | |||
|---|---|---|---|---|---|
| Ⅰ | Ⅱ | Ⅲ | Ⅳ | ||
| 增强型植被指数EVI | 拔节期 | 0.872±0.023b | 0.749±0.103c | 0.879±0.024b | 1.004±0.013a |
| 孕穗期 | 0.636±0.023b | 0.565±0.021c | 0.654±0.011b | 0.703±0.011a | |
| 开花期 | 0.192±0.007b | 0.148±0.008d | 0.172±0.001c | 0.208±0.002a | |
| 花后7 d | 0.068±0.001a | 0.057±0.002b | 0.064±0.000b | 0.070±0.001a | |
| 花后14 d | 0.180±0.007b | 0.152±0.001d | 0.164±0.004c | 0.209±0.008a | |
| 花后21 d | 0.626±0.020a | 0.550±0.001b | 0.556±0.003b | 0.512±0.019c | |
| 氮素反射指数NRI | 拔节期 | 0.140±0.022b | 0.079±0.066b | 0.154±0.029b | 0.266±0.018a |
| 孕穗期 | 0.353±0.015a | 0.330±0.022a | 0.333±0.004a | 0.336±0.004a | |
| 开花期 | 0.322±0.022a | 0.244±0.028b | 0.276±0.019b | 0.325±0.010a | |
| 花后7 d | 0.134±0.013a | 0.081±0.008b | 0.077±0.018b | 0.124±0.013a | |
| 花后14 d | 0.104±0.004a | 0.074±0.006b | 0.052±0.009c | 0.111±0.003a | |
| 花后21 d | 0.163±0.002a | 0.156±0.009a | 0.131±0.003b | 0.112±0.004c | |
| 优化土壤调节植被指数OSAVI | 拔节期 | 0.961±0.032ab | 0.834±0.137b | 1.016±0.020a | 1.128±0.019a |
| 孕穗期 | 1.030±0.011a | 0.972±0.022b | 1.036±0.004a | 1.056±0.004a | |
| 开花期 | 0.516±0.013b | 0.420±0.021c | 0.479±0.002d | 0.546±0.003a | |
| 花后7 d | 0.235±0.004a | 0.201±0.005c | 0.225±0.001b | 0.241±0.003a | |
| 花后14 d | 0.495±0.013b | 0.439±0.003d | 0.463±0.008c | 0.540±0.013a | |
| 花后21 d | 0.914±0.005a | 0.870±0.003b | 0.864±0.010b | 0.773±0.012c | |
| 叶绿素吸收反射指数TCARI | 拔节期 | 0.232±0.015a | 0.212±0.015ab | 0.177±0.004b | 0.067±0.032c |
| 孕穗期 | -0.463±0.045a | -0.367±0.064a | -0.406±0.021a | -0.367±0.010a | |
| 开花期 | -0.008±0.008b | 0.018±0.007a | -0.001±0.005b | -0.012±0.004b | |
| 花后7 d | -0.066±0.004b | -0.042±0.003a | -0.046±0.003a | -0.064±0.002b | |
| 花后14 d | -0.042±0.001c | -0.027±0.000a | -0.023±0.005a | -0.032±0.002b | |
| 花后21 d | 0.030±0.015c | 0.027±0.006c | 0.058±0.018b | 0.125±0.004a | |
表13 中强筋小麦不同类型的植被指数
Table 13
| 植被指数 Vegetation index | 生育时期 Growing stage | 品种类型Variety type | |||
|---|---|---|---|---|---|
| Ⅰ | Ⅱ | Ⅲ | Ⅳ | ||
| 增强型植被指数EVI | 拔节期 | 0.900±0.057ab | 0.920±0.047ab | 0.950±0.043a | 0.840±0.059b |
| 孕穗期 | 0.622±0.021a | 0.658±0.045a | 0.685±0.007a | 0.684±0.017a | |
| 开花期 | 0.166±0.008b | 0.181±0.016b | 0.188±0.007ab | 0.208±0.003a | |
| 花后7 d | 0.060±0.005b | 0.065±0.004ab | 0.068±0.002a | 0.071±0.001a | |
| 花后14 d | 0.155±0.008c | 0.165±0.010bc | 0.197±0.022a | 0.183±0.002b | |
| 花后21 d | 0.512±0.020b | 0.551±0.032b | 0.668±0.076a | 0.615±0.006a | |
| 氮素反射指数NRI | 拔节期 | 0.197±0.061ab | 0.187±0.033ab | 0.229±0.029a | 0.133±0.052b |
| 孕穗期 | 0.325±0.004c | 0.335±0.007bc | 0.346±0.004ab | 0.352±0.008a | |
| 开花期 | 0.223±0.081b | 0.305±0.029a | 0.293±0.005a | 0.362±0.005a | |
| 花后7 d | 0.048±0.068c | 0.110±0.024b | 0.105±0.001b | 0.168±0.004a | |
| 花后14 d | 0.028±0.034c | 0.074±0.020b | 0.082±0.006b | 0.126±0.005a | |
| 花后21 d | 0.109±0.009b | 0.135±0.020b | 0.139±0.017b | 0.183±0.015a | |
| 优化土壤调节植被指数OSAVI | 拔节期 | 1.057±0.068a | 1.039±0.035a | 1.079±0.056a | 0.954±0.080b |
| 孕穗期 | 1.022±0.013b | 1.039±0.024ab | 1.065±0.005a | 1.055±0.009ab | |
| 开花期 | 0.460±0.029b | 0.497±0.033ab | 0.510±0.014ab | 0.547±0.004a | |
| 花后7 d | 0.211±0.015b | 0.227±0.012a | 0.235±0.005a | 0.246±0.002a | |
| 花后14 d | 0.442±0.021b | 0.467±0.021b | 0.522±0.032a | 0.505±0.003a | |
| 花后21 d | 0.821±0.029c | 0.870±0.028b | 0.901±0.004ab | 0.934±0.012a | |
| 叶绿素吸收反射指数TCARI | 拔节期 | 0.113±0.065a | 0.172±0.029a | 0.119±0.088a | 0.205±0.022a |
| 孕穗期 | -0.395±0.028b | -0.445±0.038ab | -0.508±0.046a | -0.483±0.029a | |
| 开花期 | 0.011±0.017a | -0.008±0.008b | -0.002±0.003ab | -0.023±0.003b | |
| 花后7 d | -0.037±0.015c | -0.058±0.008b | -0.052±0.001b | -0.082±0.003a | |
| 花后14 d | -0.014±0.011a | -0.034±0.006b | -0.024±0.009ab | -0.054±0.005c | |
| 花后21 d | 0.068±0.015ab | 0.036±0.010b | 0.104±0.073a | -0.016±0.026c | |
由图6可知强筋小麦不同类型的植被指数变化。EVI能够反映冠层结构和生物量,在拔节期到花后21 d呈现显著的“高―低―高”趋势,其中拔节期数值最高,在花后7 d降至最低,而在花后21 d即灌浆中后期再次回升。拔节期至开花期Ⅳ均衡型的EVI显著高于其他类型,但在花后21 d显著低于其他类型,表明其灌浆中后期绿叶面积和生物量快速降低。
图6
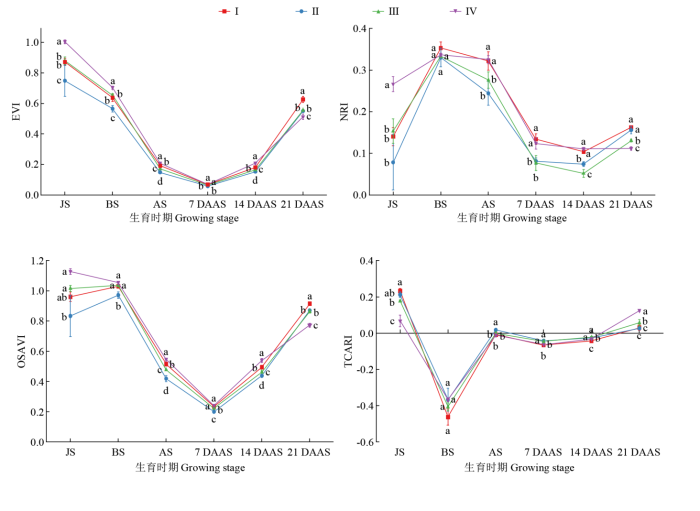
图6
强筋小麦不同类型的植被指数变化
不同小写字母表示在P < 0.05水平上差异显著。JS:拔节期;BS:孕穗期;AS:开花期;7 DAAS:花后7 d;14 DAAS:花后14 d;21 DAAS:花后21 d。下同。
Fig.6
The vegetation index changes of different types of strong gluten wheats
Different lowercase letters indicate significant differences at P < 0.05 level. JS: jointing stage; BS: booting stage; AS: anthesis stage; 7 DAAS: seven days after anthesis stage; 14 DAAS: 14 days after anthesis stage; 21 DAAS: 21 days after anthesis stage. The same below.
在花后21 d,Ⅰ类表现最好且显著高于其他类型,一定程度上显示出后期生物量维持能力与氮素含量相关,在孕穗期和开花期维持在高水平,花后21 d除了Ⅳ类其他类型均回升。在开花期到花后14 d,Ⅰ类均高于平均水平,且显著高于Ⅱ和Ⅲ类;在花后14~21 d Ⅱ类显著高于Ⅲ类。
OSAVI反映植被覆盖情况,也呈现出“V”形变化规律。在花后7~21 d,Ⅰ类均显著高于Ⅱ和Ⅲ类;在花后21 d,Ⅱ和Ⅲ类显著高于Ⅳ类。
TCARI对叶绿素含量敏感,通常与叶绿素含量呈负相关。结果显示其在孕穗期出现负值低谷。Ⅰ类在开花期至花后21 d相较于其他类型均维持在低水平,但在花后14~21 d升幅小于其他类型,表现出灌浆中后期缓慢的叶片叶绿素降解速度;Ⅱ类在花后21 d的表现与Ⅰ类相似,说明其良好的叶片持绿性,而Ⅲ类升幅大于Ⅰ和Ⅱ类,表示其叶绿素降解速度相较Ⅰ和Ⅱ类更快。
由图7可知中强筋小麦不同类型的植被指数变化。中强筋小麦的EVI和强筋小麦呈现出相似变化规律。Ⅰ类在孕穗期和花后21 d均维持在最低水平,但在花后14~21 d上升幅度相较其他类型更小;而Ⅲ类在花后14~21 d均高于其他类型。NRI从开花期开始明显下降,在花后21 d有小幅回升。Ⅰ类相较于其他类型在开花期出现断崖式下降,且一直到花后21 d相较其他类型均保持在最低水平;而Ⅱ和Ⅲ类则从孕穗期到花后21 d均表现出相近的数值。OSAVI其变化规律也与强筋小麦相似,呈现出“V”形变化规律。从孕穗期到花后21 d,Ⅰ类的OSAVI值均最低。TCARI变化规律也与强筋小麦相似,在孕穗期出现低谷。Ⅰ类在孕穗期到花后14 d均高于其他类型,在花后14~21 d上升幅度小于其他类型,说明在灌浆中后期叶绿素降解速率小于其他类型;而Ⅲ类在花后14~21 d上升幅度最大,表明其灌浆中后期叶绿素快速降解的特征。
图7
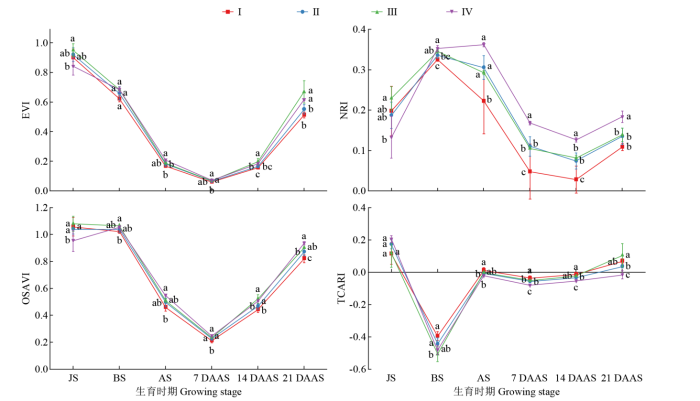
图7
中强筋小麦不同类型的植被指数变化
Fig.7
The vegetation index changes of different types of medium-strong gluten wheats
3 讨论
随着农业供给侧改革的深化,叠加消费需求升级、食品加工业转型及国际贸易格局变化,小麦品质改良已成为研究热点[23-24]。研究[15,25-26]表明,小麦产量与品质的形成不仅由遗传因素决定,还与生态环境密切相关。然而,黄淮海北片近年推广的新育成小麦品种在不同生态区表现出显著差异[27]。因此,可有效利用基因与环境互作效应,系统评估其产量与品质的生态适应性,推动产量品质协同提升[15,28]。本研究表明,黄淮海北部试点的中强筋小麦品种平均产量为7993.24 kg/hm2,变异系数为8.04%,其中11个品种产量超过7600 kg/hm2,登海206和衡4399在赵县试点的产量甚至突破9000 kg/hm2。强筋小麦的平均产量高于中强筋品种,表明2类品种(系)均具备高产潜力。进一步分析产量构成因素发现,中强筋品种的高产主要依赖高的成穗数,而强筋品种(系)则通过高千粒重实现高产。这一结果与前期研究一致,即群体数量和籽粒灌浆能力是小麦高产的关键驱动因素。例如,登海206的高产得益于其高穗粒数与千粒重,说明优化分蘖成穗与同化物转运能力是提升产量的核心策略[29]。
基于聚类分析,强筋小麦和中强筋小麦被划分为4类:Ⅰ高产优质型、Ⅱ高产型、Ⅲ优质型和Ⅳ均衡型。这一分类揭示了产量与品质的关系:高产型品种通常蛋白质含量低,而优质型品种因光合产物更多分配至籽粒氮积累,导致生物量受限。例如,农大171的蛋白质含量最高,但其成穗数低于高产型。
无人机多光谱遥感分析从冠层尺度揭示了不同类型品种的光谱生理特征,强筋小麦中Ⅰ高产优质型在花后21 d表现出显著高EVI、高OSAVI和低TCARI的特征,表明该类型在生育后期具有更完整的冠层结构和叶片生理活性,能够通过延缓衰老来保障高产与优质[34-35];Ⅱ类品种(系)各项植被指数在各生育期高于平均值;Ⅲ类品种(系)花后14 d的NRI降至全生育期最低,推测是因为该时期发生了快速的氮素转运[16]。中强筋小麦各植被指数变化规律与强筋小麦相似,Ⅰ类品种(系)EVI和OSAVI在花后21 d降至所有类型中的最低水平,NRI从开花期迅速下降并维持在低水平,表明其在花后将茎叶中的干物质和氮素迅速转移至籽粒,以实现高产与优质的平衡[18];Ⅲ类品种(系)的突出特征是花后21 d时EVI和OSAVI值都达到最高水平,同时TCARI也是最高值,呈现出后期持续性降低的特征[20]。
4 结论
(1)中强筋品种济麦4072、山农66和强筋品种济麦221001、藁优5218产量均超过7600 kg/hm2,中强筋高产主要依赖高成穗数,而强筋品种(系)则通过较高的千粒重实现高产。GGE双标图表明强筋品种(系)藁优5218、济麦221001和中强筋品种济麦4072、山农66兼具高产与稳产特性。聚类分析表明,济麦221001、藁优5218为高产优质型强筋品种(系),济麦4072、山农66为高产优质型中强筋品种。
(2)强筋小麦中Ⅰ高产优质型在开花期具有高NDVI值,在灌浆前期到后期降幅最小,表现出后期较好的持绿性。
(3)相较于其他类型,高产优质型的强筋小麦在花后21 d即灌浆中后期维持了显著的高EVI与低TCARI。高产优质型的中强筋小麦在花后21 d表现出显著低EVI、低OSAVI和低NRI。灌浆中后期EVI可作为快速筛选强筋及中强筋高产优质型的关键指标。
参考文献
Current situation and key parameters for improving wheat quality in China
DOI:10.3389/fpls.2021.638525
URL
[本文引用: 1]

Processing quality of winter-wheat is affected by genotype, environmental conditions, and crop husbandry practices. In the present study, a data set of 17 quality-related traits for 211 main winter-wheat varieties in China during 2006 to 2018 was extracted from China Wheat Quality Report. Analysis was carried out to evaluate the quality status and variations, to reveal correlation between quality-related traits, as well as to identify key influencing factors. Results indicated that the quality indicators of medium-gluten or medium-strong-gluten wheat varieties were acceptable, whereas those of weak- and strong-gluten wheat varieties were far below national standard, especially hardness index (HI), crude protein content (CPC), wet gluten content (WG), and water absorption for weak-gluten wheat and sedimentation value (SV), stability time (ST), and stretch area (SA) for strong-gluten wheat, respectively. Correlation analysis showed that WA, WG, development time, HI, CPC, falling number, ST, and tractility directly affected the overall quality of winter-wheat. CPC, SV, and WG in medium-gluten wheat had no significant correlation with the processing quality of noodles score, whereas gluten index significantly correlated with noodle score (P &lt; 0.001). This implied that protein quality might play a more important role than protein quantity in determining medium-gluten wheat quality. Furthermore, analysis of variance showed that genetic characteristics (cultivars) had significant influences on the restriction indexes (SV, ST, and SA) of strong-gluten wheat, whereas genetic characteristics, environment conditions, and crop growing practices (cultivars, locations, and years) significantly affected the restriction indexes (HI, CPC, WG, and WA) of weak-gluten wheat. The results suggest that improvement of Chinese strong-gluten wheat should mainly focus on cultivating new varieties. As to weak-gluten wheat, cultivation and husbandry practices should be paid more attention to limit undesired high grain protein content.
Did wheat breeding simultaneously improve grain yield and quality of wheat cultivars releasing over the past 20 years in China?
DOI:10.3390/agronomy12092109 URL
Coordinating yield and quality formation of wheat through post-anthesis nitrogen spraying
DOI:10.1016/j.crope.2024.12.004
[本文引用: 1]
It is a challenge to maintain high yields while improving grain quality of wheat under limited water and nitrogen supply conditions. To achieve a simultaneous improvement of yield and quality, a field trial was conducted from 2021 to 2023. Treatments with different timings (5, 10, and 15 d after anthesis) and frequencies of spraying nitrogen (1, 2, and 3 times) were set up after anthesis under a water-saving cultivation system. Spraying nitrogen after anthesis significantly increased grain yield and protein content by 4.99% and 6.00%, respectively. The increase in grain yield was mainly due to the improvement in grain weight, which was attributed to increased grain filling and starch synthesis. Spraying nitrogen once at 15 d after anthesis (T15 D) was optimal. T15 D treatment increased the photosynthetic pigment content and the enzyme activities of carbon and nitrogen metabolism of the flag leaves. T15 D increased the pre-anthesis nitrogen remobilization to grains by 4.71%-9.06% compared to the other spraying treatments, and promoted the accumulation of nitrogen in the grains. Moreover, T15 D optimized the protein composition of the grains and improved processing quality at maturity. In conclusion, spraying nitrogen at 15 d after anthesis may be an effective measure to simultaneously improve the yield and quality of winter wheat under a water-saving cultivation system.
中国冬小麦品质改良研究进展
DOI:10.3864/j.issn.0578-1752.2013.20.002
[本文引用: 1]
小麦是中国第三大粮食作物,在农业生产和食品工业中占有重要地位。随着中国经济和社会的发展,消费者的生活需求正在发生变化,工业化和城市化使食品工业,特别是传统食品工业化加速发展。与此同时,食品工业对食品原料的专用化和规模化,即品种的质量、规格和数量,提出了更高的要求。如何研究和解决这一矛盾,已成为小麦产业和食品工业可持续发展的新问题。本文以国内发表的论著为基础,整理、分析了小麦品质改良历史、研究进展、存在问题;讨论了小麦产业链和食品加工业的可持续发展对优质小麦的需求;结合农业生产和食品工业的发展趋势提出建议,供小麦育种、生产、收贮、食品加工等部门和研究人员参考。
Global food demand and the sustainable intensification of agriculture
Optical techniques in non- destructive detection of wheat quality: a review
基因型、环境对新疆冬小麦品种蛋白质品质的影响
DOI:10.6048/j.issn.1001-4330.2022.01.006
【目的】研究基因型和环境对新疆冬小麦品种蛋白质品质性状的影响。【方法】选用762份新疆冬小麦品种种植于新疆3个地点,检测籽粒蛋白质含量、湿面筋含量、面筋指数、沉淀值以及面团揉合特性等8个蛋白质品质性状。【结果】新疆冬小麦品种的籽粒蛋白质含量为14.44%,湿面筋含量为32.37%,面筋指数为61.86%,Zeleny沉淀值为26.25 mL,峰值时间为2.67 min,峰值高度为53.09%,8 min宽度为15.30%,8 min面积为107.16%TQ×min,多数品种属中筋类型。不同地点间小麦蛋白质品质性状存在差异,蛋白质数量性状表现为阿克苏点>石河子点>伊宁点,蛋白质质量性状表现为伊宁点>石河子点>阿克苏点,3个地点间的蛋白质质量性状表现出显著差异。基因型、环境及G×E互作效应对蛋白质品质性状均有影响,但作用大小不同,环境为47.62%~68.94%,G×E为23.34%~41.38%,基因型为7.71%~11.00%。不同类型的蛋白质品质性状稳定性不同,其中籽粒蛋白质含量、湿面筋含量、Zeleny沉淀值、峰值时间、8 min宽度和8 min面积稳定性表现为石河子点>阿克苏点>伊宁点,峰值高度稳定性表现为伊宁点>石河子点>阿克苏点,面筋指数稳定性表现为阿克苏点>伊宁点>石河子点。【结论】基因型、环境及G×E对新疆冬小麦品种蛋白质品质性状均有显著影响作用,依次为环境>G×E>基因型;新疆小麦品种多属中筋类型,除籽粒蛋白质含量和湿面筋含量外,其他蛋白品质性状均未达到国标优质强筋的标准,且强筋小麦品种较少;不同地点的蛋白质品质特性不同,阿克苏点蛋白质数量性状总体优于石河子点与伊宁点,伊宁点蛋白质质量性状表现总体优于石河子点和阿克苏点;不同品质性状的稳定性不同,籽粒蛋白质含量、湿面筋含量、Zeleny沉淀值、峰值时间、8 min宽度和8 min面积在石河子点稳定性较好,峰值高度在伊宁点稳定性较好,面筋指数在阿克苏点稳定性较好;小偃54号、小偃22号、百农68、中优206、中麦175等,可供新疆冬小麦蛋白质品质改良利用。
基于无人机影像特征的冬小麦植株氮含量预测及模型迁移能力分析
DOI:10.3864/j.issn.0578-1752.2023.05.004
【目的】氮素的精准监测和合理施用对小麦健康生长、产量及品质提升、减少农田环境污染与资源浪费尤为重要。为精准监测小麦生长关键生育期植株氮含量,探索机器学习方法构建的植株氮含量预测模型的迁移能力。【方法】小区试验于2020—2022年在河南省商水县开展,在冬小麦拔节期、孕穗期、开花期和灌浆期,采用M600大疆无人机搭载K6多光谱成像仪获取5波段(Red、Green、Blue、Rededge、Nir)多光谱影像。基于5个波段冠层反射率提取20种植被指数和40种纹理特征,采用相关分析从65个影像特征中筛选冬小麦植株氮含量敏感特征。基于筛选出的敏感特征,采用BP神经网络(BP)、随机森林(RF)、Adaboost、支持向量机(SVR)4种机器学习回归方法构建植株氮含量预测模型,并对模型预测效果和在不同水处理条件下模型的迁移预测能力进行分析。【结果】(1)植株氮含量与影像特征的相关系数通过0.01极显著水平检验的包括22个光谱特征和29个纹理特征。(2)4种机器学习回归方法构建的冬小麦植株氮含量预测模型存在差异,RF和Adaboost方法预测植株氮含量集中于95%的置信区间,多分布于1﹕1直线附近,而BP和SVR方法预测的植株氮含量分布相对较为分散;RF方法构建的预测模型R 2最大,RMSE最小,MAE中等,分别为0.81、0.42%和0.29%;SVR方法构建的预测模型R 2最小,RMSE和MAE较大,分别为0.66、0.54%和0.40%。(3)以W1处理(按需灌溉)实测植株氮含量为训练集,采用BP、RF、Adaboost和SVR方法构建的模型对W0处理冬小麦植株氮含量迁移预测R 2分别为0.75、0.72、0.72和0.66;以W0处理(自然状态)实测植株氮含量为训练集,BP、RF、Adaboost和SVR方法构建的模型对W1处理冬小麦植株氮含量迁移预测R 2分别为0.51、0.69、0.61和0.45。【结论】4种机器学习方法构建的冬小麦植株氮含量预测模型均表现出了较强的迁移预测能力,尤以RF和Adaboost方法构建的模型预测效果和迁移能力为好。
基于无人机影像多时相的小麦品种氮效率分类识别
DOI:10.3864/j.issn.0578-1752.2024.09.006
[本文引用: 2]
【目的】探索无人机遥感在氮效率分类识别中的潜力,构建小麦品种氮效率分类方法,为氮高效品种筛选提供理论依据和技术支持。【方法】通过6个成熟期与氮效率密切相关的农学指标(产量、植株氮积累、氮素生理利用效率、植株干生物量、籽粒总吸氮量、N收获指数)构建主成分综合值,并对其进行K-Means聚类分析,将121个小麦品种划分为氮高效型、氮中效型和氮低效型3种类型。利用无人机遥感平台搭载多光谱相机,在小麦拔节期、孕穗期和开花期获取无人机遥感影像,并提取34种植被指数,分析植被指数与氮效率综合值的相关性;对比支持向量机(SVM)、随机森林(RF)和K最近邻(KNN)分类方法的氮效率分类模型精度,使用总体分类精度(OA)和Kappa系数比较不同生育时期下小麦品种氮效率分类识别的能力;并使用3种不同的特征集筛选方法(ReliefF算法、Boruta算法和RF-RFE算法)对优化的特征子集进行综合评价,确立适宜的小麦品种氮效率分类识别方法。【结果】随着小麦生育时期的不断推进,植被指数与氮效率综合值的相关性逐渐提高,开花期最高(r=0.502);利用植被指数全特征集对小麦品种氮效率进行分类,对于单生育时期数据而言,以开花期的SVM模型分类效果最好(OA=77.1%,Kappa=0.591),拔节期最差(OA=65.6%,Kappa=0.406);总体而言,多生育时期数据融合的品种氮效率分类精度高于单生育时期,其中以拔节期+孕穗期+开花期3个生育时期数据融合的SVM模型的分类效果最优(OA=80.6%,Kappa=0.669)。为减少多生育时期数据融合的特征集变量数量,比较分析RF-RFE、Boruta和ReliefF 3种算法的特征优化效果,基于RF-RFE算法得到的优化特征子集分类精度最高,其OA和Kappa系数比全特征集分类模型分别提高了4.0%和10.1%,其中,以3个生育时期数据融合的分类效果最好(OA=85.4%,Kappa=0.749)。【结论】确立6个氮效率指标—主成分分析—K-Means氮效率评价方法;RF-RFE算法有效优化多生育时期组合的特征子集数量,且获得较高的分类精度,确立基于多生育时期组合—RF-RFE—SVM技术融合的小麦品种氮效率分类模型,为小麦氮高效品种的快速准确分类鉴定提供理论依据和技术支撑。
UAV- and machine learning-based retrieval of wheat SPAD values at the overwintering stage for variety screening
DOI:10.3390/rs13245166
URL
[本文引用: 1]
In recent years, the delay in sowing has become a major obstacle to high wheat yield in Jiangsu Province, one of the major wheat producing areas in China; hence, it is necessary to screen wheat varieties are resilient for late sowing. This study aimed to provide an effective, fast, and non-destructive monitoring method of soil plant analysis development (SPAD) values, which can represent leaf chlorophyll contents, for late-sown winter wheat variety screening. This study acquired multispectral images using an unmanned aerial vehicle (UAV) at the overwintering stage of winter wheat growth, and further processed these images to extract reflectance of five single spectral bands and calculated 26 spectral vegetation indices. Based on these 31 variables, this study combined three variable selection methods (i.e., recursive feature elimination (RFE), random forest (RF), and Pearson correlation coefficient (r)) with four machine learning algorithms (i.e., random forest regression (RFR), linear kernel-based support vector regression (SVR), radial basis function (RBF) kernel-based SVR, and sigmoid kernel-based SVR), resulted in seven SVR models (i.e., RFE-SVR_linear, RF-SVR_linear, RF-SVR_RBF, RF-SVR_sigmoid, r-SVR_linear, r-SVR_RBF, and r-SVR_sigmoid) and three RFR models (i.e., RFE-RFR, RF-RFR, and r-RFR). The performances of the 10 machine learning models were evaluated and compared with each other according to the achieved coefficient of determination (R2), residual prediction deviation (RPD), root mean square error (RMSE), and relative RMSE (RRMSE) in SPAD estimation. Of the 10 models, the best one was the RF-SVR_sigmoid model, which was the combination of the RF variable selection method and the sigmoid kernel-based SVR algorithm. It achieved high accuracy in estimating SPAD values of the wheat canopy (R2 = 0.754, RPD = 2.017, RMSE = 1.716 and RRMSE = 4.504%). The newly developed UAV- and machine learning-based model provided a promising and real time method to monitor chlorophyll contents at the overwintering stage, which can benefit late-sown winter wheat variety screening.
基因型和环境对小麦产量、品质和氮素效率的影响
DOI:10.3724/SP.J.1006.2019.81072
[本文引用: 1]
以不同基因型的小麦品种(13个强筋小麦品种和2个中筋小麦品种), 不同试验地点(馆陶、宁晋、藁城)和不同施氮水平(0、180、240和300 kg hm -2)的田间试验, 综合分析基因型、环境对小麦产量、品质、氮肥利用率的影响, 以期为优质强筋小麦品种选育、栽培调控及高产提质增效的协同目标提供科学依据。研究表明, 不同小麦品种产量在9289~10,088 kg hm -2之间, 强筋小麦品种平均产量9548 kg hm -2, 比中筋小麦品种减产3.1%。藁城、宁晋、馆陶三地的产量分别达9932、9433和9223 kg hm -2。不同小麦品种籽粒蛋白质均值14.5%, 湿面筋28.5%, 沉淀指数39.5 mL, 稳定时间15.4 min, 拉伸能量87.5 cm 2, 最大拉伸阻力428.8 BU。藁优5218、藁优5766、冀麦738、科农2009、师栾02-1、藁优2018、冀麦867综合品质表现较好。馆陶和宁晋的小麦品质性状相对较好, 藁城的品质较差。氮肥利用率随施氮量增加呈降低趋势, N180处理的氮肥农学效率、氮肥吸收利用效率、氮肥生理利用率最高, 依次为4.3 kg kg -1、26.2%、16.6 kg kg -1。兼顾产量、品质、效率三方面, 藁城适宜种植品种有冀麦738、冀麦867、师栾02-1; 宁晋有师栾02-1、科农2009、冀麦738; 馆陶有藁优5766、藁优2018、师栾02-1。综合考虑小麦产量、籽粒品质和氮素利用率, 180 kg hm -2为本研究条件下的最佳施氮量。
钾肥施用量对2种筋型小麦主要品质性状的影响
DOI:10.3969/j.issn.1004-3268.2008.10.018
[本文引用: 1]
在大田条件下,研究了钾肥施用量对强筋小麦郑麦9023和弱筋小麦豫麦50号籽粒品质、粉质仪参数和淀粉糊化特性的影响。结果表明,适宜的钾肥施用量可明显改善郑麦9023和豫麦50号的品质和淀粉糊化特性,增施钾肥能够提高强筋小麦籽粒干、湿面筋含量、形成时间、稳定时间、评价值和稀懈值,降低强筋小麦峰值黏度、低谷黏度、最终黏度、降落值和弱化度。钾肥施用量对弱筋小麦主要品质性状的影响与强筋小麦呈相反趋势。在豫西地区,强筋小麦和弱筋小麦最适宜的钾肥施用量(K2O)均为112.5kg/hm^2。
Comparison of UAV RGB imagery and hyperspectral remote-sensing data for monitoring winter wheat growth
DOI:10.3390/rs14153811
URL
[本文引用: 1]
Although crop-growth monitoring is important for agricultural managers, it has always been a difficult research topic. However, unmanned aerial vehicles (UAVs) equipped with RGB and hyperspectral cameras can now acquire high-resolution remote-sensing images, which facilitates and accelerates such monitoring. To explore the effect of monitoring a single crop-growth indicator and multiple indicators, this study combines six growth indicators (plant nitrogen content, above-ground biomass, plant water content, chlorophyll, leaf area index, and plant height) into the new comprehensive growth index (CGI). We investigate the performance of RGB imagery and hyperspectral data for monitoring crop growth based on multi-time estimation of the CGI. The CGI is estimated from the vegetation indices based on UAV hyperspectral data treated by linear, nonlinear, and multiple linear regression (MLR), partial least squares (PLSR), and random forest (RF). The results are as follows: (1) The RGB-imagery indices red reflectance (r), the excess-red index (EXR), the vegetation atmospherically resistant index (VARI), and the modified green-red vegetation index (MGRVI), as well as the spectral indices consisting of the linear combination index (LCI), the modified simple ratio index (MSR), the simple ratio vegetation index (SR), and the normalized difference vegetation index (NDVI), are more strongly correlated with the CGI than a single growth-monitoring indicator. (2) The CGI estimation model is constructed by comparing a single RGB-imagery index and a spectral index, and the optimal RGB-imagery index corresponding to each of the four growth stages in order is r, r, r, EXR; the optimal spectral index is LCI for all four growth stages. (3) The MLR, PLSR, and RF methods are used to estimate the CGI. The MLR method produces the best estimates. (4) Finally, the CGI is more accurately estimated using the UAV hyperspectral indices than using the RGB-image indices.
Characterization of N distribution in different organs of winter wheat using UAV-based remote sensing


