
作物杂志,2020, 第4期: 188–194 doi: 10.16035/j.issn.1001-7283.2020.04.027
基于冠层光谱的早籼稻籽粒粗蛋白含量估测
田容才( ), 高志强, 卢俊玮()
- 湖南农业大学农学院,410128,湖南长沙
Estimation of Crude Protein Content in Grain of Early Indica Rice Based on Canopy Spectrum
Tian Rongcai(), Gao Zhiqiang, Lu Junwei()
- Agronomy College of Hunan Agricultural University, Changsha 410128, Hunan, China
摘要:
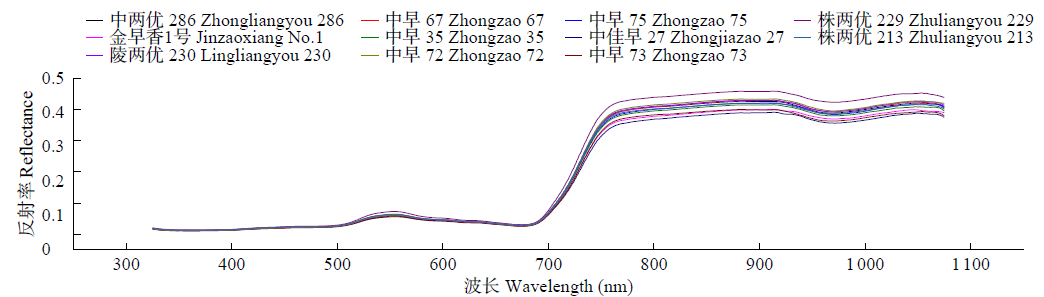
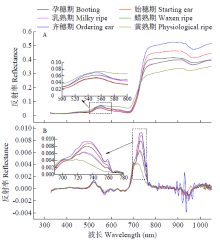
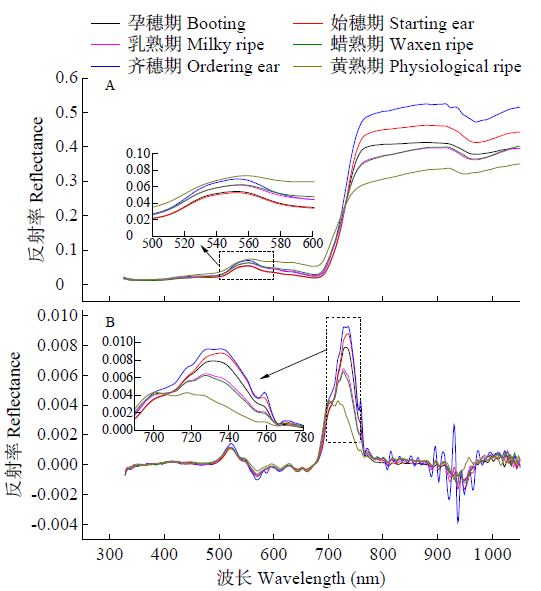
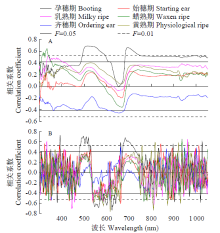
利用2019年长江中下游早籼稻早中熟组种质资源为材料,分析主要生育期冠层光谱反射率与籽粒粗蛋白含量的关系,筛选出可用于早籼稻籽粒粗蛋白含量预测的敏感生育期和敏感波长,建立了基于敏感波长和光谱参数的籽粒粗蛋白的一元线性、多元线性、指数和多项式预测模型,用决定系数(R 2)、均方根误差(RMSE)和相对误差(RE)对模型精度进行评价,以期找到估测早籼稻籽粒粗蛋白含量的最适模型。研究发现,在孕穗期514、580、638和695nm波长处冠层一阶微分光谱反射率与籽粒粗蛋白含量相关性达到极显著水平;在基于敏感波长的估测模型中,四元线性模型估测效果最佳,其建模集R 2、RMSE和RE分别为0.566、0.342%和2.874%,验证集R 2、RMSE和RE分别为0.518、0.154%和1.303%;在基于光谱参数构建的估测模型中,DSI(R′514和R′638)为自变量构建的多项式模型估测效果较优,其建模集R 2、RMSE和RE分别为0.638、0.312%和2.639%,验证集R 2、RMSE和RE分别为0.581、0.230%和2.307%。


| [1] | Raubenheimer D, Simpson S J . Nutritional ecology and human health. Annual Review of Nutrition, 2016,36:603-626. |
| [2] | 彭波, 孙艳芳, 韩秋 , 等. 水稻种子蛋白质含量检测方法的比较分析. 江苏农业科学, 2018,46(4):22-28. |
| [3] | 贺佳, 刘冰峰, 黎世民 , 等. 不同生育时期冬小麦籽粒蛋白质含量的高光谱遥感监测模型. 中国生态农业学报, 2017,25(6):865-875. |
| [4] | 张晗, 赵小敏, 郭熙 , 等. 基于冠层高光谱信息的水稻生长监测应用研究进展. 江苏农业科学, 2018,46(12):1-9. |
| [5] | 吴琼, 齐波, 赵团结 , 等. 高光谱遥感估测大豆冠层生长和籽粒产量的探讨. 作物学报, 2013,39(2):309-318. |
| [6] | 高鑫 . 春玉米LAI和叶片氮素营养及产量的高光谱估测模型研究. 呼和浩特:内蒙古农业大学, 2016. |
| [7] | 李岚涛, 任涛, 汪善勤 , 等. 基于角果期高光谱的冬油菜产量预测模型研究. 农业机械学报, 2017,48(3):221-229. |
| [8] | 李媛媛, 常庆瑞, 刘秀英 , 等. 基于高光谱和BP神经网络的玉米叶片SPAD值遥感估算. 农业工程学报, 2016,32(16):135-142. |
| [9] | Rodrigues Jr F A, Blasch G, Defourny P , et al. Multi-temporal and spectral analysis of high-resolution airborne imagery for precision agriculture:assessment of wheat grain yield and grain protein content. Remote Sensing, 2018,10(6):930-955. |
| [10] | 周冬琴, 朱艳, 姚霞 , 等. 基于水稻冠层光谱特征构建粳型水稻籽粒蛋白质含量预测模型. 作物学报, 2007,33(8):1219-1225. |
| [11] | 薛利红, 曹卫星, 李映雪 , 等. 水稻冠层反射光谱特征与籽粒品质指标的相关性研究. 中国水稻科学, 2004,18(5):57-62. |
| [12] | Onoyama H, Ryu C, Suguri M , et al. Estimation of rice protein content before harvest using ground-based hyperspectral imaging and region of interest analysis. Precision Agriculture, 2018,19:721-734. |
| [13] | Song X Y, Yang G J, Yang C H , et al. Spatial variability analysis of within-field winter wheat nitrogen and grain quality using canopy fluorescence sensor measurements. Remote Sensing, 2017,9(3):237-254. |
| [14] | 孙雪梅, 周启发, 何秋霞 . 利用高光谱参数预测水稻叶片叶绿素和籽粒蛋白质含量. 作物学报, 2005,31(7):844-850. |
| [15] | 李永梅, 张立根, 张学俭 . 水稻叶片高光谱响应特征及氮素估算. 江苏农业科学, 2017,45(23):210-213. |
| [16] | 于滋洋, 王翔, 孟祥添 , 等. 考虑水分光谱吸收特征的水稻叶片SPAD预测模型. 光谱学与光谱分析, 2019,39(8):2528-2532. |
| [17] | 刘桃菊, 张笑东, 胡雯君 , 等. 水稻冠层光谱红边特征及其与叶片氮素营养状况的关系. 2014年中国作物学会学术年会论文集, 南京:中国作物学会, 2014: 131. |
| [18] | 谢晓金, 李秉柏, 朱红霞 . 利用高光谱数据估测不同温度胁迫下的水稻籽粒中粗蛋白和直链淀粉含量. 农业现代化研究, 2012,33(4):481-484. |
| [19] | 张浩, 胡昊, 陈义 , 等. 水稻叶片氮素及籽粒蛋白质含量的高光谱估测模型. 核农学报, 2012,26(1):135-140. |
| [20] | Ryu C, Suguri M, Iida M , et al. Integrating remote sensing and gis for prediction of rice protein contents. Precision Agriculture, 2011(3):378-394. |
| [21] | Asaka D, Shiga H . Estimating rice grain protein contents with SPOT/HRV data acquired at maturing stage. Journal of the Remote Sensing Society of Japan, 2003,23(5):451-457. |
| [22] | 唐延林, 黄敬峰, 王人潮 . 利用高光谱法估测稻穗稻谷的粗蛋白质和粗淀粉含量. 中国农业科学, 2004,37(9):1282-1287. |
| [23] | 张浩, 姚旭国, 张小斌 , 等. 水稻籽粒蛋白质含量的高光谱估测研究. 中国粮油学报, 2009,24(11):1-5. |
| [24] | 仲晓春, 何理, 陈莹莹 , 等. 基于高光谱的稻米品质估测模型的构建. 扬州大学学报(农业与生命科学版), 2012,33(2):34-38. |
| [25] | 陈瑛瑛, 王徐艺凌, 朱宇涵 , 等. 水稻穗部氮素含量高光谱估测研究. 作物杂志, 2018(5):116-120. |
| [26] | 丁锦峰, 朱新开, 王君婵 , 等. 基于开花期卫星影像的春性中、弱筋小麦籽粒蛋白质含量遥感预测. 云南农业大学学报(自然科学), 2015,30(6):932-940. |
| [27] | 李振海, 杨贵军, 王纪华 , 等. 作物籽粒蛋白质含量遥感监测预报研究进展. 中国农业信息, 2018,30(1):46-54. |
| [28] | Li Z H, Taylor J, Yang H , et al. A hierarchical interannual wheat yield and grain protein prediction model using spectral vegetative indices and meteorological data. Field Crops Research, 2020,248:107711-107718. |
| [29] | 李振海, 徐新刚, 金秀良 , 等. 基于氮素运转原理和GRA-PLS算法的冬小麦籽粒蛋白质含量遥感预测. 中国农业科学, 2014,47(19):3780-3790. |
| [30] | 依尔夏提·阿不来提, 买买提·沙吾提, 白灯莎·买买提艾力 , 等. 基于随机森林法的棉花叶片叶绿素含量估算. 作物学报, 2019,45(1):81-90. |
| [31] | Siegmann B, Jarmer T . Comparison of different regression models and validation techniques for the assessment of wheat leaf area index from hyperspectral data. International Journal of Remote Sensing, 2015,36(18):4519-4534. |
| [32] | Wang L, Chang Q R, Li F L , et al. Effects of growth stage development on paddy rice leaf area index prediction models. Remote Sensing, 2019,11(3):361-378. |
| [1] | 刘卫星,贺群岭,张枫叶,范小玉,陈雷,李可,吴继华. 大粒花生品种区域试验的AMMI模型分析[J]. 作物杂志, 2020, (2): 60–64 |
| [2] | 杨甜,张永清,董馥慧,马星星,薛小娇. 不同水分条件下不同抗旱性苦荞根系生长规律研究[J]. 作物杂志, 2019, (6): 76–82 |
| [3] | 董智强,王萌萌,李鸿怡,薛晓萍,潘志华,侯英雨,陈辰,李楠,李曼华. WOFOST模型对山东省夏玉米发育期与产量模拟的适用性评价[J]. 作物杂志, 2019, (5): 159–165 |
| [4] | 花宇辉,高志强. 秋玉米SPAD值的光谱估算模型研究[J]. 作物杂志, 2019, (5): 173–179 |
| [5] | 董哲,杨武德,张美俊,朱洪芬,王超. 基于高光谱遥感的玉米叶片SPAD值估算模型研究[J]. 作物杂志, 2019, (3): 126–131 |
| [6] | 代希茜,詹和明,崔兴洪,赵银月,单丹丹,张亮,王铁军. 玉米大豆间作种植密度耦合数学模型及其优化方案研究[J]. 作物杂志, 2019, (2): 128–135 |
| [7] | 唐双勤,吴自明,谭雪明,曾勇军,石庆华,潘晓华,曾研华. 直播早籼稻品种芽期耐冷性鉴定研究[J]. 作物杂志, 2019, (1): 159–167 |
| [8] | 王汉霞,单福华,田立平,马巧云,赵昌平,张风廷. 北部冬麦区冬小麦区试品种(系)的稳定性和适应性分析[J]. 作物杂志, 2018, (5): 40–44 |
| [9] | 陈瑛瑛,王徐艺凌,朱宇涵,武威,刘涛,孙成明. 水稻穗部氮素含量高光谱估测研究[J]. 作物杂志, 2018, (5): 116–120 |
| [10] | 曲歌,陈争光,王雪. 基于近红外光谱与SIMCA和PLS-DA的水稻品种鉴别[J]. 作物杂志, 2018, (2): 166–170 |
| [11] | 侯维海,王建林,旦巴,胡单. 青稞光合作用5种光响应模型的比较分析[J]. 作物杂志, 2017, (4): 96–104 |
| [12] | 何文昭,王红武,胡小娇,李坤,王琪,吴宇锦,刘志芳,黄长玲. 玉米株高和穗位高在不同环境下的数量遗传分析[J]. 作物杂志, 2017, (3): 13–18 |
| [13] | 宁东贤,赵玉坤,闫翠萍,杨秀丽,肖俊红,杨丽萍. 山西省南部花生品种产量稳定性的模型分析及评价[J]. 作物杂志, 2017, (3): 39–43 |
| [14] | 顾鑫,王平,杨晓贺,姚亮亮,刘伟,赵海红,丁俊杰,申宏波. 三江平原水稻鞘腐病短期预测模型的建立[J]. 作物杂志, 2017, (3): 162–165 |
| [15] | 陈霞燕,王连喜,任景全,郭春明,李琪,李莹莹. 吉林省春玉米生产潜力及其敏感性分析[J]. 作物杂志, 2016, (6): 91–98 |
|
||