
作物杂志,2023, 第2期: 36–45 doi: 10.16035/j.issn.1001-7283.2023.02.006
基于GGE双标图的高粱品种农艺性状和稳产性分析
肖继兵( ), 刘志(), 孔凡信, 辛宗绪, 吴宏生
- 辽宁省旱地农林研究所,122000,辽宁朝阳
Analysis of Agronomic Traits and Yield Stability of Sorghum Varieties Based on GGE Biplot
Xiao Jibing(), Liu Zhi(), Kong Fanxin, Xin Zongxu, Wu Hongsheng
- Liaoning Institute of Agriculture & Forestry in Arid Areas, Chaoyang 122000, Liaoning, China
摘要:
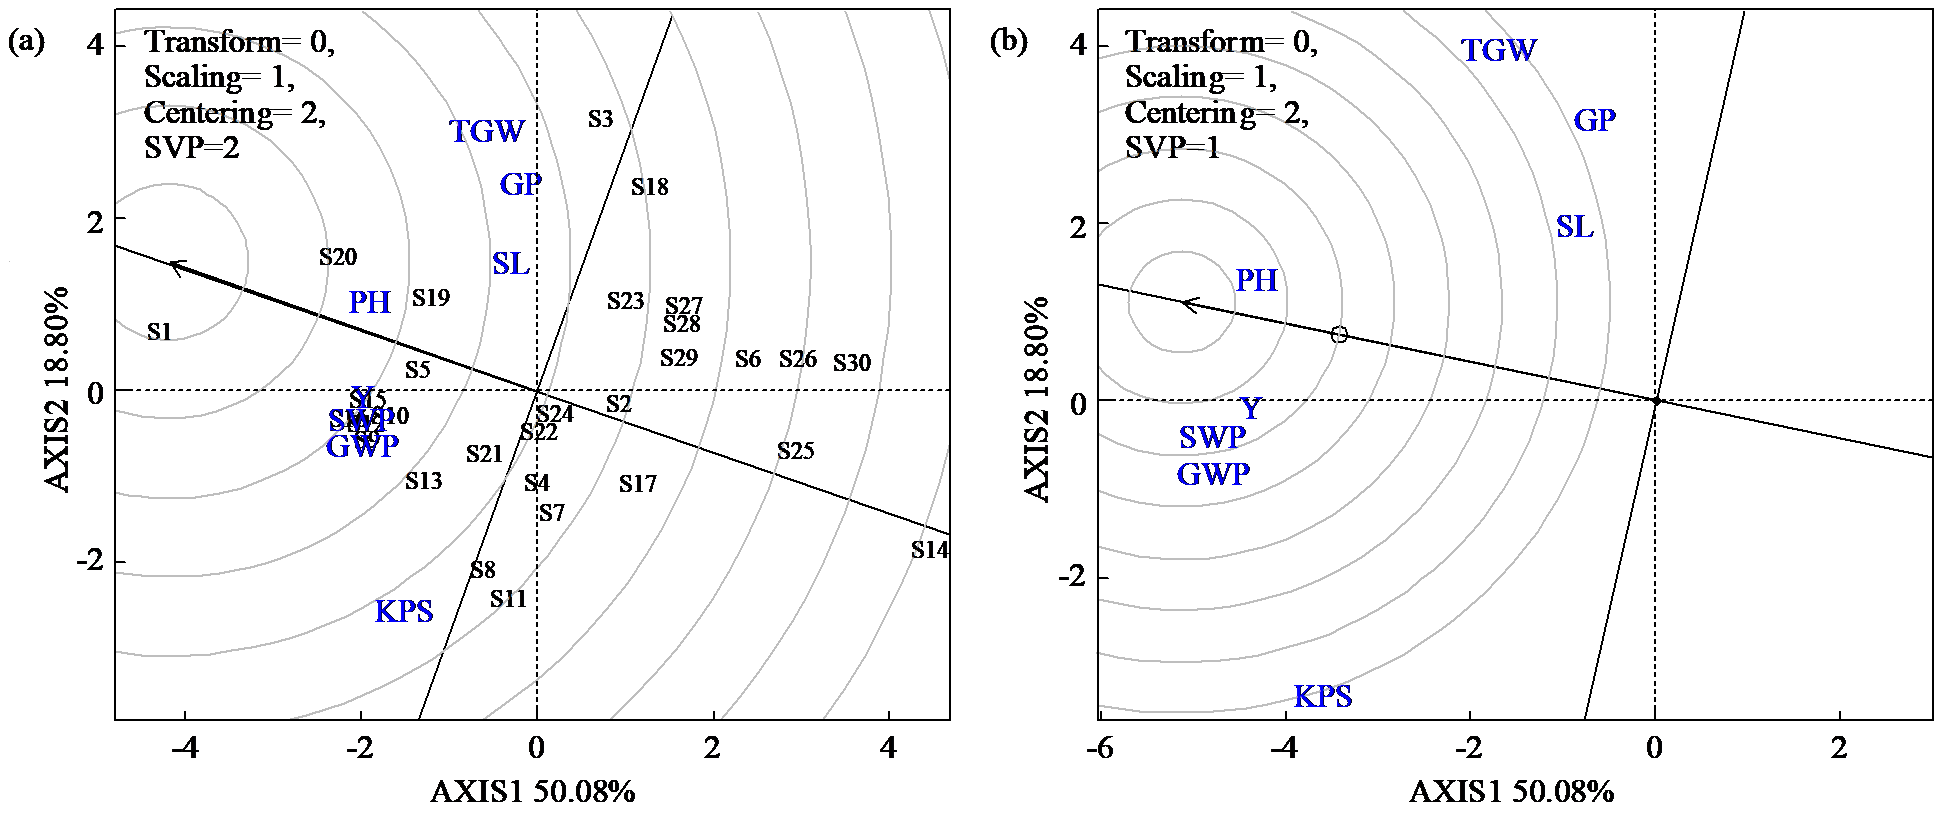
为了筛选丰产稳产、适应性强的高粱新品种,促进辽西地区高粱产业健康可持续发展。2019-2020年采用随机不完全区组设计(alpha-格子设计),通过R语言GGE双标图分析了30个高粱品种的产量和相关农艺性状。方差分析表明,年份、基因型、基因型与年份互作对高粱产量和相关农艺性状均有显著影响(P<0.05),其产量变异的平方和占总平方和的比例分别为32.1%、41.3%和11.3%,基因型效应对产量和相关农艺性状的变异贡献率最大,株高和穗长指标遗传力较大。GGE双标图分析表明,辽杂19号、平试13和济粱2丰产稳产性较好;辽杂19号和平试13在株高、产量、穗重和穗粒重方面综合性状表现较好;辽杂19号距离“理想品种”最近,其次为平试13。皮尔逊相关分析表明,高粱籽粒产量与株高、穗重、穗粒重和穗粒数均呈极显著正相关(P<0.01)。从参试品种看,辽西半干旱地区高秆品种比矮秆品种更具产量优势。在朝阳地区,辽杂19号、平试13和济粱2具有较高的产量和稳定性。在特定生态区域,基因型是产量和相关农艺性状差异的主要因素。

| [1] | 卢庆善. 高粱学. 北京: 中国农业出版社,1999. |
| [2] | Yan W. GGE Biplot vs. AMMI graphs for genotype-by- environment data analysis. Journal of the Indian Society of Agricultural Statistics, 2011, 65(2):1-10. |
| [3] | 常磊, 柴守玺. GGE双标图在我国旱地春小麦稳产性分析中的应用. 中国生态农业学报, 2010, 18(5):988-994. |
| [4] | 许乃银, 张国伟, 李健, 等. 基于GGE双标图的棉花品种生态区划分. 应用生态学报, 2013, 24(3):771-776. |
| [5] | 严威凯, 盛庆来, 胡跃高, 等. GGE叠图法―分析品种×环境互作模式的理想方法. 作物学报, 2001, 27(1):21-28. |
| [6] |
Yang R C, Blade S, Crossa J. Identifying isoyield environments for field pea production. Crop Science, 2005, 45(1):106-113.
doi: 10.1002/csc2.v45.1 |
| [7] | Crossa J. Statistical analyses of multilocation trials. Advances in Gronomy, 1990, 44(1):55-85. |
| [8] |
Yang R C, Crossa J, Cornelius P L, et al. Biplot analysis of genotype×environment interaction:proceed with caution. Crop Science, 2009, 49(5):1564-1576.
doi: 10.2135/cropsci2008.11.0665 |
| [9] | 石强, 李亚杰, 范士杰, 等. 贵州省马铃薯区试品种产量与农艺性状的GGE双标图分析. 干旱地区农业研究, 2015, 33(2):5-15. |
| [10] | 李吉睿, 孟亚雄, 司二静, 等. 中国西北水地春小麦基因型与环境互作及其产量稳定性分析. 甘肃农业大学学报, 2016, 51(6):44-52. |
| [11] |
Yan W, Pageau D, Frégeau-Reid J, et al. Oat mega-environments and test-locations in Quebec. Canadian Journal of Plant Science, 2011, 91(4):643-649.
doi: 10.4141/cjps10139 |
| [12] | 常磊, 韩凡香, 柴守玺, 等. 我国旱地小麦区域试验精确度及其环境综合评价. 应用生态学报, 2013, 24(10):2814-2820. |
| [13] |
Freeman G H, Perkins J M. Environmental and genotype- environmental components of variability Ⅷ-Relations between genotypes grown in different environments and measures of these environments. Heredity, 1971, 27:15-23.
doi: 10.1038/hdy.1971.67 |
| [14] | Yan W K, Kang M S. GGE biplot analysis:A Graphical Tool for Breeders,Geneticists,and Agronomists. Boca Raton, Florida: CRC Press, 2003. |
| [15] |
Yan W, Hunt L A. Cultivar evaluation and mega-environment investigation based on GGE biplot. Crop Science, 2000, 40(3):597-605.
doi: 10.2135/cropsci2000.403597x |
| [16] |
Yan W, Holland J B. A heritability-adjusted GGE biplot for test environment evaluation. Euphytica, 2010, 171(3):355-369.
doi: 10.1007/s10681-009-0030-5 |
| [17] |
Dehghani H, Ebadi A, Yousefi A. Biplot analysis of genotype by environment interaction for barley yield in Iran. Agronomy Journal, 2006, 98:388-393.
doi: 10.2134/agronj2004.0310 |
| [18] | 昝凯, 陈亚光, 徐淑霞, 等. 基于R语言的GGE双标图在大豆区试中的应用. 大豆科技, 2019(4):16-20. |
| [19] | 陈四龙, 李玉荣, 程增书, 等. 用GGE双标图分析种植密度对高油花生生长和产量的影响. 作物学报, 2009, 35(7):1328-1335. |
| [20] |
Yan W. GGE biplot—A Windows application for graphical analysis of multi environment trial data and other types of two‐ way data. Agronomy Journal, 2001, 93(5):1111-1118.
doi: 10.2134/agronj2001.9351111x |
| [21] | 李亚杰, 罗磊, 白江平, 等. GGE双标图在西北旱区马铃薯新品种选育中的应用. 干旱地区农业研究, 2018, 36(2):192-198. |
| [22] |
严威凯. 双标图分析在农作物品种多点试验中的应用. 作物学报, 2010, 36(11):1805-1819.
doi: 10.3724/SP.J.1006.2010.01805 |
| [23] |
Luo L, Zhang F, Hong M, et al. Evaluation of yield,stability and adaptability of national winter rapeseed regional trials in the upper Yangtze River region in 2017-2018. Oil Crop Science, 2020, 5(3):121-128.
doi: 10.1016/j.ocsci.2020.07.001 |
| [24] |
Flores F, Hybl M, Knudsen J C, et al. Adaptation of spring faba bean types across European climates. Field Crops Research, 2013, 145:1-9.
doi: 10.1016/j.fcr.2013.01.022 |
| [25] |
Yan W. LG biplot:a graphical method for mega-environment investigation using existing crop variety trial data. Scientific Reports, 2019, 9(1):1-8.
doi: 10.1038/s41598-018-37186-2 |
| [26] | Choudhary M, Kumar B, Kumar P, et al. GGE biplot analysis of genotype × environment interaction and identification of mega- environment for baby corn hybrids evaluation in India. Indian Journal of Genetics and Plant Breeding, 2019, 79(4):658-669. |
| [27] |
de Oliveira T R A, de Carvalho H W L, Oliveira G H F, et al. Hybrid maize selection through GGE biplot analysis. Bragantia, 2019, 78(2):166-174.
doi: 10.1590/1678-4499.20170438 |
| [28] |
Yan W, Pageau D, Frégeau-reid J, et al. Assessing the representativeness and repeatability of test locations for genotype evaluation. Crop Science, 2011, 51(4):1603-1610.
doi: 10.2135/cropsci2011.01.0016 |
| [29] |
Badu-apraku B, Akinwale R O. Biplot analysis of line× tester data of maize (Zea mays L.) inbred lines under stress and nonstress environments. Cereal Research Communications, 2019, 47(3):518-530.
doi: 10.1556/0806.47.2019.25 |
| [30] |
Xi K, Turkington T K, Juskiw P, et al. Field screening is effective for identifying genetic resistance to scald of barley. Crop Science, 2019, 59(4):1479-1493.
doi: 10.2135/cropsci2018.09.0536 |
| [31] |
Shojaei S H, Mostafavi K, Khosroshahli M, et al. Assessment of genotype-trait interaction in maize (Zea mays L.) hybrids using GGT biplot analysis. Food Science Nutrition, 2020, 8(10):5340-5351.
doi: 10.1002/fsn3.v8.10 |
| [32] | Shiri M, Kamrani M, Ebadi A. Evaluation of integrated nitrogen and phosphorous management using the TT biplot method in soybean. Journal of Agricultural Sciences, 2020, 65(1):19-35. |
| [33] |
Baduapraku B, Akinwale R O. Cultivar evaluation and trait analysis of tropical early maturing maize under Striga-infested and Striga-free environments. Field Crops Research, 2011, 121(1):186-194.
doi: 10.1016/j.fcr.2010.12.011 |
| [34] | 周宇飞, 依兵, 吴奇, 等. 基于GGE双标图的高粱品种产量及其稳定性分析. 沈阳农业大学学报, 2018, 49(6):649-654. |
| [35] | 彭远英, 颜红海, 郭来春, 等. 燕麦属不同倍性种质资源抗旱性状评价及筛选. 生态学报, 2011, 31(9):2478-2491. |
| [36] | 陆平. 高粱种质资源描述规范和数据标准. 北京: 中国农业出版社, 2006. |
| [37] |
Yan W, Hunt L A, Sheng Q, et al. Cultivar evaluation and mega- environment investigation based on the GGE biplot. Crop Science, 2000, 40(3):597-605.
doi: 10.2135/cropsci2000.403597x |
| [38] |
Belay F, Meresa H, Gebreslasie A. Evaluation of the performance of some white seeded sesame (Sesamum Indicum L.) genotypes using GGE biplot analysis in Northern Ethiopia. Journal of Cereals and Oilseeds, 2018, 9(1):1-9.
doi: 10.5897/JCO |
| [39] | 赵祖亮, 曲艺伟, 刘哲, 等. 玉米产量的品种与环境互作效应空间分布规律. 农业工程学报, 2015, 31(24):232-238. |
| [40] |
陈彩锦, 张尚沛, 师尚礼, 等. 基于GGE双标图对苜蓿品种丰产性和稳定性综合评价. 草地学报, 2021, 29(5):912-918.
doi: 10.11733/j.issn.1007-0435.2021.05.007 |
| [41] | 柳娜, 曹东, 王世红, 等. 基于GGE双标图的甘肃春小麦区试品系稳产性和试点代表性分析. 西北农林科技大学学报(自然科学版), 2018, 46(4):39-48. |
| [42] | Kabak D, Akçura M. Bingöl ilinden toplanan yerel çavdarlarda tane verimi ve bazı özellikler arasındaki ilişkilerin biplot analizi ile incelenmesi. Türk Tarım ve Doğa Bilimleri Dergisi, 2017, 4(2):227-235. |
| [43] | Sabaghnia N. Investigation of some morphological traits in studied lentil (Lens culinaris Medik.) genotypes grown with foliar application of nanosized ferric oxide//Annales Universitatis Mariae Curie-Sklodowska,sectio C-Biologia. Wydawnictwo Uniwersytetu Marii Curie-Skłodowskiej, 2014, 69(2):29-38. |
| [44] |
肖继兵, 刘志, 孔凡信, 等. 种植方式和密度对高粱群体结构和产量的影响. 中国农业科学, 2018, 51(22):4264-4276.
doi: 10.3864/j.issn.0578-1752.2018.22.005 |
| [1] | 杨世奇, 陈丽明, 周燕芝, 谭雪明, 曾勇军, 石庆华, 潘晓华, 曾研华. 杂草防除对双季直播优质晚籼稻产量和稻米品质的影响[J]. 作物杂志, 2023, (2): 121–125 |
| [2] | 刘宇, 曹家林, 肖正午, 张鸣宇, 陈佳娜, 曹放波, 黄敏. 施氮量对超级杂交稻Y两优900产量与氮肥利用率的影响[J]. 作物杂志, 2023, (2): 126–130 |
| [3] | 马瑞琦, 王德梅, 陶志强, 王艳杰, 杨玉双, 赵广才, 常旭虹. 追氮量对不同筋型小麦品种产量及农艺性状的调控效应[J]. 作物杂志, 2023, (2): 131–137 |
| [4] | 崔淑娜, 王晔, 卢雨晴, 潘金豹, 张秋芝. 玉米穗三叶与产量的相关和通径分析[J]. 作物杂志, 2023, (2): 201–206 |
| [5] | 徐东, 何建清, 张格杰, 刘海鑫, 马金玉, 王思远. 化肥配施园林废弃物堆肥对青稞产质量及土壤肥力的影响[J]. 作物杂志, 2023, (2): 214–221 |
| [6] | 马继钰, 王爽, 李云, 郭振清, 王健, 林小虎, 韩玉翠. 种植密度对谷子农艺性状及产量的影响[J]. 作物杂志, 2023, (2): 222–228 |
| [7] | 曹志敏, 范保杰, 刘长友, 张志肖, 曹玉梅, 王彦, 苏秋竹, 王珅, 刘建军, 田静. 60Co辐射对绿豆主要农艺性状影响及特异突变体创制[J]. 作物杂志, 2023, (2): 30–35 |
| [8] | 顾逸彪, 颜佳倩, 薛张逸, 束晨晨, 张伟杨, 张耗, 刘立军, 王志琴, 周振玲, 徐大勇, 杨建昌, 顾骏飞. 耐盐性不同水稻品种根系对盐胁迫的响应差异及其机理研究[J]. 作物杂志, 2023, (2): 67–76 |
| [9] | 唐中杰, 谢德意, 许守明, 聂利红, 吕淑平, 王明坤. 2005-2020年转Bt基因棉花抗虫性变化及其与产量性状的相关性分析[J]. 作物杂志, 2023, (2): 77–82 |
| [10] | 袁帅, 苏雨婷, 陈平平, 易镇邪. 氮肥运筹对湘南双季杂交稻生长发育与稻米品质的影响[J]. 作物杂志, 2023, (2): 91–99 |
| [11] | 夏玉莹, 王志君, 李红宇, 胡传军, 吕艳东, 赵海成, 郑桂萍. 育苗方式对寒地水稻秧苗素质、产量及品质的影响[J]. 作物杂志, 2023, (1): 103–108 |
| [12] | 高伟, 郝青婷, 张泽燕, 王茜, 闫虎斌, 朱慧珺, 赵雪英, 张耀文. 施氮磷肥对小豆产量、根系形态及光合特性的影响[J]. 作物杂志, 2023, (1): 109–114 |
| [13] | 王玉娇, 常旭虹, 王德梅, 王艳杰, 杨玉双, 石书兵, 赵广才. 播种方式对不同品种小麦产量和品质的影响[J]. 作物杂志, 2023, (1): 122–128 |
| [14] | 赵晶云, 吕新云, 刘小荣, 任海红, 任小俊, 马俊奎. 幼龄核桃林下带状复合间作对大豆生长及产量的影响[J]. 作物杂志, 2023, (1): 136–142 |
| [15] | 翟彩娇, 张蛟, 崔士友, 陈澎军, 韩继军. 盐逆境下缓/控释肥对水稻生长发育、产量和品质的影响[J]. 作物杂志, 2023, (1): 143–151 |
|
||